Gunn, astromechanics. Forecasts, discussion - page 13
You are missing trading opportunities:
- Free trading apps
- Over 8,000 signals for copying
- Economic news for exploring financial markets
Registration
Log in
You agree to website policy and terms of use
If you do not have an account, please register
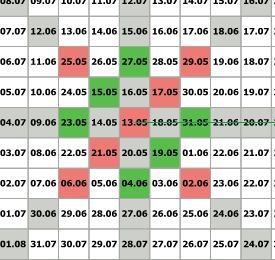
What's the big deal - open your terminal - 15 minutes - the 27th - 3am countdown time = green high price - red low
Take into account the daily cycle that the 27th number is high and the trend is up - red cells are the best time to buy against the trend -
what is the performance of the forecast and why is there a 30 pips drawdown?
I don't know why I've made such a prediction. You may as well just throw out vertical and horizontal lines and 90% of them will bounce and coincide.
I spent 2 months - this month I made a profit of 600 pips on AUD taking all the peaks and bases due to these dates - I knew the dates weeks in advance -
in some thread you yourself wrote that you missed the trades. i.e. the profit is hypothetical but the drawdown is real...
what is the execution of the forecast and why is it a sell with a 30 p. drawdown?
You might as well just randomly scatter vertical and horizontal lines and 90% of them will bounce and coincide with each other.
...better a lesson in loss rather than loss of opportunity and regret about it.
I think it's better to miss a good deal than to enter a bad one.
The Gann supposedly allows you to predict both the timing of reversals and the price.
so why get ahead of time and price?
I do not want to worry, it is better to make a loss than to miss a chance to regret it.
Would you draw your vision of the movement on Monday? For the third time now I ask to make a screenshot from the trading terminal with trend lines, because I already have doubts about the truthfulness
i am making my own predictions, but i do not take time into account, only price, i have got 1000p over two weeks for the eu, so i consider it a luck and some kind of "the eu-trend".
When going by Gunn, plan to spend at least 4 years with the original material to begin to understand something ...
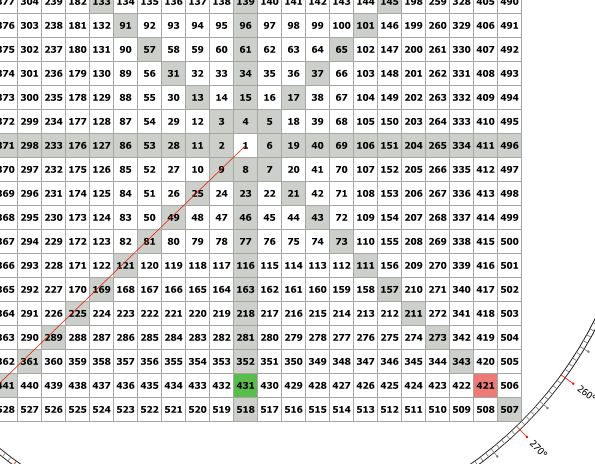
hjlujghglu : You want a Gunn 9 square, here's a calculator... put in the number you want to flatten from and how many levels. You don't need to colour in anything...
http://financialscript.com/finances/gann-calculator.html
I must be doing it wrong... I put in 16035, 07/14/2008, 9 and got the eu at 1.64.
.... I didn't want to post all this here in the first place - because why post a shovel with which to rake gold? ...
Would you draw your vision of the movement on Monday? For the second time I ask to make a screenshot from the trading terminal with trend lines, because I already have doubts about the truthfulness
i am making my own predictions, but i do not take time into account, only price, i have got 1000p over two weeks for the eu, so i consider it a luck and some kind of "the eu-trend".
If it jumps over the Pit of Sine and Ghana by dates I will be surprised - but so 2 numbers are low - low price - after that it will go back up -
I cannot say how much the market will fall - in cycles it may be 100 pips or even 200 - the numbers are too much
The low cycle finishes at 06.06. - who will risk to keep falling down till 06.06. on Monday? The problem is that 31st is Tuesday and before the high price may go up by 100 points - we wait until Tuesday.
We will wait till Tuesday and then we will decide if we should sell or not. If the peak comes, we will sell.
I'm starting to understand a little bit.
Am I thinking correctly, you should put Low 13.05 in the centre and then diagonally to the bottom left corner all the squares will be Low (as marked in your lower picture).
And then moving clockwise (you can also counterclockwise) alternating marking with different colours, skipping one square.
What is the horizontal green line in the picture (drawn from 13.05-31.05-21.06-20.07)?
I can't figure out why you need to build separately for High and Low. It's (as you said) to make sure the forecast is correct if the two calculations coincide. Just because of this?I'm starting to understand a little bit.
Am I thinking correctly, you should put Low 13.05 in the centre and then diagonally to the bottom left corner all the squares will be Low (as marked in your lower picture).
And then moving clockwise (you can also counterclockwise) alternating marking with different colours, skipping one square.
And what is the horizontal green line in the picture (drawn through 13.05-31.05-21.06-20.07)?
I can't figure out why you need to build separately for High and Low. It's (as you said) to make sure the forecast is correct if the two calculations coincide. Just because of this?Here's another study - the market is perfectly balanced if it works according to this scheme on the history looks just gorgeous - the future has exactly the same matrix
I made some more forecasts - save them - to check them in a month
Here's a forecast until August !
And possibly to the end of the year -
Mixon777
and you only use 3 digits after the decimal point? Is there a difference in using 4 digits?
And how do you determine that the price has chosen e.g. angle 441 (price 1.441). Then what? The price will move diagonally to the centre ....???? Not clear.