Technical analysis - A scam for beginners? - page 35
You are missing trading opportunities:
- Free trading apps
- Over 8,000 signals for copying
- Economic news for exploring financial markets
Registration
Log in
You agree to website policy and terms of use
If you do not have an account, please register
here is the same piece of euro$ chart only m 15 (M5 too many candles.
Next we see the withdrawal:
it reaches 50.0 or more in principle with 50.0 you can add on. If you want to.
Then the price goes back to B/S. If we have raised the stops up, we have also made a profit.
Here we kind of added from 50.0 and moved the stops up. the result - by the time b / o we have a trade added in the plus. and then we only move the stop on it.
and the two trades that were opened before - they both have profits. one at 161.8 and another one at 200.0.
It is advisable to enter before 123.4 which is why I don't like smaller charts. And M5 is the most reliable for calculating targets.
Shall I continue?
but if you spread it over the plugs, i.e. in a sequence of plugs. Would that work?
purely to make indicators that help to draw something automatically... but I don't think so...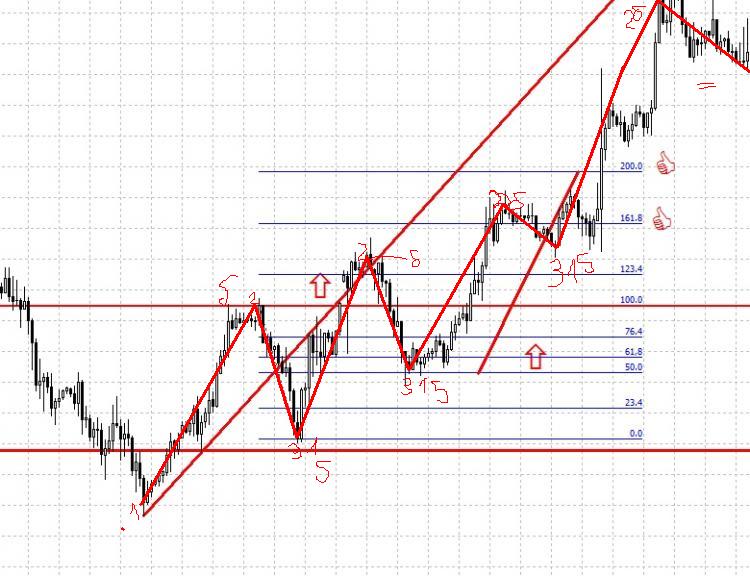
maybe try it this way?
Look at H4, there are white candles in a column (lows one above the other). then black candles - breaking the sequence. then a breakthrough can be described?
I think it may work in the program. The main thing is that it should be able to retrace the correction - A wave, pull the fibo (to reach the 61.8 level) and define the breakthrough on M5.
IgorM:
Trends: trends are really only visible on history, when it starts and when it ends no one knows, not even the most sophisticated mathematical models and indicators
Yeah, trends are a pain in the ass: it's easy to measure how long it is "now", but how long will it last? :)
I'm also thinking about pullbacks at the moment. I suddenly came up with the idea of pattern trading - because bounce may be different. Now I'm thinking about it. :)
Yeah, trends are a bitch: it's not a problem to measure how long it's "now", but how long will it last? :)