Breaking through the morning flat - which pairs? - page 7
You are missing trading opportunities:
- Free trading apps
- Over 8,000 signals for copying
- Economic news for exploring financial markets
Registration
Log in
You agree to website policy and terms of use
If you do not have an account, please register
While this is going on, I finalised my indicator based on the supertrend. Entry by colour change of circles with pendulum from the border of the channel. Exit as desired. The larger the channel is, the stronger the signal for reversal should be. Watch and think, I hope it will be useful. Not a grail, of course, but it filters false signals against the trend well.
Here are the results of testing on historical 2009 - 2010 sliding channel strategies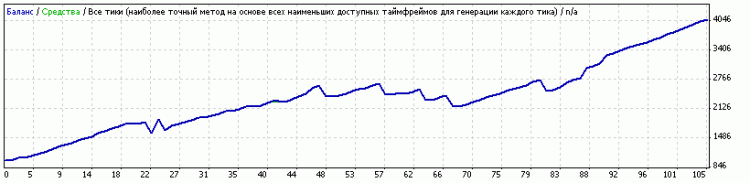
Initial deposit 1000.00
Net profit 3077.78
Total profit 4819.60
Total loss -1741.82
Profitability 2.77
Expected payoff 29.31
Absolute Drawdown 154.24
Maximum drawdown 536.94 (19.90%)
Relative drawdown 23.73% (263.08)
Total trades 105
Short Positions (% of Winners) 56 (83.93%)
Long positions (% of winners) 49 (81.63%)
Profitable trades (% of all) 87 (82.86%)
Profitable trades (% of all) 18 (17.14%)
Largest
profitable transaction 303.92
Loss trade -248.52
Average
profitable deal 55.40
Loss trade -96.77
Maximal amount
continuous wins (profit) 24 (1567.16)
continuous losses (loss) 2 (-248.80)
Maximum
Continuous Profit (number of wins) 1567.16 (24)
Continuous loss (number of losses) -248.80 (2)
Average
continuous winnings 7
Here are the results of the 2009-2010 historical testing of the sliding channel strategy
Tell me more about it. Maybe you can show an EA.
This is Borispolz's sliding channel strategy. All of the author's trading recommendations have been implemented in the EA except for the stop.
Here http://strategy4you.ru/category/prostaya-strategiya-foreks a lot of similar breakout strategies with EAs including EURUSD and EURGBP
I'm not so sure if they are effective, by the way, I got the Expert Advisor template from the "heap" :)
Посмотрите советника к этому КРАСИВОМУ индикатору
The EA on the tester does not work in either optimisation or test mode.
I'll show up for sure :) I just don't have time for everything. When I'm done with the flip reneko, I'll take on the supertrend. If it doesn't work out, I'll come back here. I've got the idea in my head, I'll work on it.
Sergiy! I think the reversal has a potential but why on the Renko? Maybe I should use these fractals and apply them to the coup strategy?
I think they may be "digitized", I do not know the correct name for it in mql.
There are accordingly four formations that fully represent the structure of price movements.
The formation A is called "true bullish fractal". Correspondingly, B is a "false bullish fractal". The shapes C and D are "true bear fractal" and "false bear fractal". Formation A has positive leverage, the momentum is greater than the pullback, and the trader makes a profit. Formation B, on the other hand, indicates negative leverage. The upward movement is less than the downward movement, momentum is less than the pullback, and the trader takes a loss. Formation C is a true bearish fractal, momentum is greater than the pullback, leverage is positive. And for formation D the leverage is negative, the momentum is less than the pullback.
And the question for which timeframe is your indicator Dsergg-hSuperTrend_v2.5.mq4 not fully commented in the code?
When using which TF to change which variables.
Well, any given formation could be a continuation of any... or the beginning. Or I don't get it... What is the usefulness of the fact that we, for example, saw formation "A"?
Well, any given formation could be a continuation of any... or the beginning. Or I don't get it... What is the usefulness of the fact that we for example saw formation "A"?