Time series forecasting with Deductor Academic 5.2 - page 2
You are missing trading opportunities:
- Free trading apps
- Over 8,000 signals for copying
- Economic news for exploring financial markets
Registration
Log in
You agree to website policy and terms of use
If you do not have an account, please register
Thank you so much, that's a great tutorial.
I don't know what to say, I just used MA for the example, but the advantage of the Deductor over the Metatrader is that you can load
and analyse 10-100 times more information (prices themselves, indicator values, many currency pairs at once, etc.) in a reasonable amount of time.
You obviously didn't understand the problem ;)
The matter is that we want to see a forecast not for one bar but for some (to see the long-term price trend). All figures in the forecast are calculated for the next bar only. For further figures they should be given initial data which we do not have yet (because we are forecasting it). If we check our forecast by taking existing data (like checking the accuracy of forecasts), then we can input values on bars in the future (Tc+1, Tc+2, Tc+3,.....) with input data from known to us from history, ie implicitly we look into the future that we do not know and only want to make a forecast.
To sum it up: if we want to get a fair forecast, we should use values calculated during the previous step of the forecast. I.e.: the first forecast value is calculated with the last known live data. The next value is calculated from the previous (first calculated) value, and so on. And only after all this data is compared with real historical data.
If we take the conditional value prediction task of MA using known OHLC, it cannot be solved correctly for several bars ahead. To calculate the second predicted value of MA, you need to input new OHLC from the bar you do not have (because you have calculated only MA for it and OHLC was not predicted and not calculated). If you take OHLC from the "test" history - it means that you have looked into the future. That's where the rake lies :(
tell me how to save, so that the result will be drawn on a graph afterwards
I have a text one:
20.05.2009 10:00 1,35557143 1,35578571 1,35587143 1,35597143 1,3562 1,35634286 1,3568 1,35772857 1,35892857 1,36027143 1,36132857 1,3622 1,36301429 1,36304286 1,36305714 1,36291429 1,36241429 1,36231429 1,36255714 1,36311429 1,36375714 1,36392857 1,36401429 1,36442857 1,36451429 1,36414286 1,36317143 1,36278571 1,36264286 1,36237143 1,36185714 1,3618 1,36222857 1,36304286 1,35474286 1,35485714 1,35495714 1,3551 1,35524286 1,3553 1,35581429 1,3569 1,35824286 1,35922857 1,36014286 1,36101429 1,36142857 1,36125714 1,36125714 1,36082857 1,36047143 1,36038571 1,36075714 1,36141429 1,36222857 1,36247143 1,3628 1,3634 1,3632 1,36235714 1,36182857 1,3616 1,36138571 1,36084286 1,36037143 1,36061429 1,36151429 1,36208571 1,35367143 1,35388571 1,35408571 1,35418571 1,35425714 1,35437143 1,35424286 1,35492857 1,35601429 1,35715714 1,35815714 1,35895714 1,35921429 1,35964286 1,35935714 1,35914286 1,35884286 1,35854286 1,3586 1,35941429 1,3603 1,36121429 1,36164286 1,36208571 1,36217143 1,36175714 1,36107143 1,36055714 1,36038571 1,35987143 1,35921429 1,35918571 1,35981429 1,36055714
20.05.2009 11:00 1,35578571 1,35587143 1,35597143 1,3562 1,35634286 1,3568 1,35772857 1,35892857 1,36027143 1,36132857 1,3622 1,36301429 1,36304286 1,36305714 1,36291429 1,36241429 1,36231429 1,36255714 1,36311429 1,36375714 1,36392857 1,36401429 1,36442857 1,36451429 1,36414286 1,36317143 1,36278571 1,36264286 1,36237143 1,36185714 1,3618 1,36222857 1,36304286 1,36394286 1,35485714 1,35495714 1,3551 1,35524286 1,3553 1,35581429 1,3569 1,35824286 1,35922857 1,36014286 1,36101429 1,36142857 1,36125714 1,36125714 1,36082857 1,36047143 1,36038571 1,36075714 1,36141429 1,36222857 1,36247143 1,3628 1,3634 1,3632 1,36235714 1,36182857 1,3616 1,36138571 1,36084286 1,36037143 1,36061429 1,36151429 1,36208571 1,36287143 1,35388571 1,35408571 1,35418571 1,35425714 1,35437143 1,35424286 1,35492857 1,35601429 1,35715714 1,35815714 1,35895714 1,35921429 1,35964286 1,35935714 1,35914286 1,35884286 1,35854286 1,3586 1,35941429 1,3603 1,36121429 1,36164286 1,36208571 1,36217143 1,36175714 1,36107143 1,36055714 1,36038571 1,35987143 1,35921429 1,35918571 1,35981429 1,36055714 1,36105714
and yours is like this:
20.05.2009 21:00 1.3785 1.3766 1.37398571
20.05.2009 22:00 1.37991429 1.37797143 1.37534286
20.05.2009 23:00 1.37975714 1.37787143 1.37664286
21.05.2009 1.37955714 1.37761429 1.37644286
21.05.2009 1:00 1.37932857 1.37772857 1.37642857
21.05.2009 2:00 1.37951429 1.37807143 1.37668571
21.05.2009 3:00 1.37931429 1.3777 1.37678571
21.05.2009 4:00 1.37868571 1.37735714 1.37638571
21.05.2009 5:00 1.37865714 1.37787143 1.37657143
21.05.2009 6:00 1.37901429 1.37802857 1.37682857
21.05.2009 7:00 1.37921429 1.37811429 1.37692857
21.05.2009 8:00 1.37927143 1.3781 1.37697143
21.05.2009 9:00 1.37937143 1.37811429 1.37687143
21.05.2009 10:00 1.37944286 1.37827143 1.37692857
21.05.2009 11:00 1.3802 1.37811429 1.37652857
21.05.2009 12:00 1.38018571 1.37798571 1.37624286
21.05.2009 13:00 1.38018571 1.37791429 1.37614286
21.05.2009 14:00 1.38017143 1.37774286 1.37602857
21.05.2009 15:00 1.3802 1.37731429 1.37562857
21.05.2009 16:00 1.37991429 1.37691429 1.37508571
21.05.2009 17:00 1.3798 1.37675714 1.37475714
21.05.2009 18:00 1.37935714 1.3772 1.37491429
21.05.2009 19:00 1.38072857 1.37861429 1.37551429
21.05.2009 20:00 1.38207143 1.3802 1.37682857
21.05.2009 21:00 1.38392857 1.38207143 1.37861429
21.05.2009 22:00 1.38577143 1.3844 1.38057143
21.05.2009 23:00 1.38764286 1.38632857 1.38272857
22.05.2009 1.38932857 1.38824286 1.38477143
22.05.2009 1:00 1.39085714 1.38968571 1.38688571
22.05.2009 2:00 1.39138571 1.39031429 1.38831429
22.05.2009 3:00 1.39215714 1.39114286 1.38911429
22.05.2009 4:00 1.3926 1.3917 1.3898
22.05.2009 5:00 1.3931 1.39221429 1.39052857
22.05.2009 6:00 1.39358571 1.39275714 1.39114286
22.05.2009 7:00 1.39392857 1.39308571 1.39145714
What am I doing wrong?
You obviously did not understand the problem ;)
Bottom line: if you want to get a fair forecast, you should use values calculated during the previous step of the forecast. I.e.: the first forecast value is calculated using the last known live data. The next value is calculated from the previous (first calculated) value, and so on. And only after all this, the data are compared with the real historical data.
If we take the conditional task of MA value prediction using known OHLC, it cannot be solved correctly for several bars ahead. You will calculate only one next value of MA, to calculate the second predicted value of MA you should use new OHLC from the bar which you do not have (because you have calculated MA for it and OHLC was not predicted and not calculated). If you take OHLC from the "test" history - it means that you have looked into the future. That's where the rake lies :(
There is no rake in the deductor ;) for the forecast of the next bar is calculated using the previous calculated bars. For example, let P0 -> zero bar = B1+B2+B3,
Then P1=P0+B1+B2, P2=P1+P0+B1, etc. Where B is history bars and P is forecast bars.
As for МА: I think you confuse yourselves, the deducer doesn't care what to analyze. In this example, the MA values are calculated in the terminal by OHLC and the
on the basis of MA values. However, if you want to thoroughly study the deductor possibilities, you may first analyze OHLC in the terminal and select the
Custom Model and describe there the MA calculation algorithm (select OHLC...). I'm sure the calculations will match to some decimal place ;)
How do I save it so that the result is plotted on a graph?
what am i doing wrong?This is the default.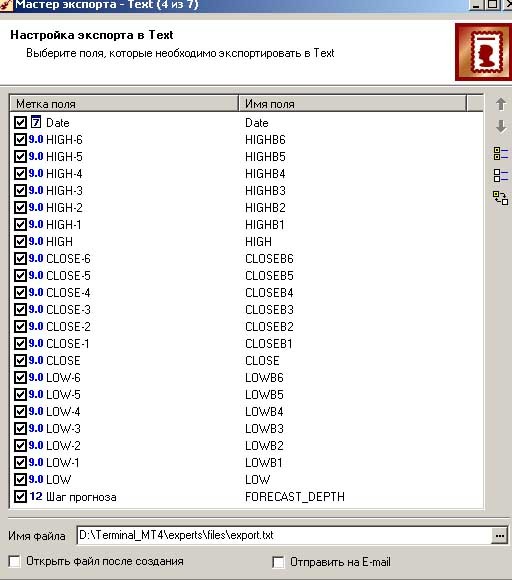
And you need to select only 4 lines:
Or you can take demo example Example_MA_H1.ded as template, copy all branch in it, change paths to input and output files in your terminal,
read and print the helper of the deductor there all in russian detailed description where to press....
There is no rake in the deductor ;) because the next bar prediction is calculated using previous calculated bars.
The rake is not in the deductor but in the formulation of the problem... Let me try to put it another way:
if you have OHLC + MA and you are forecasting only the next MA value, then to calculate the next one after the latest (current) bar you have all data Open[0], High[0], Low[0], Close[0] and MA(.....)[0] you will get MA[-1]
if you are only forecasting MA, then MA[-1] you have calculated, where will you get Open[-1], High[-1], Low[-1], Close[-1] to calculate the next MA[-2] ? :)))
you cannot take them from the existing history (to check how it predicts), because it's just a simple look into the future :(
It turns out that you need to predict not only MA but also a full set of OHLC and use this predicted data in further MA prediction. but then why do you need MA if you have OHLC prediction? ;)
It's the default.
And you need to select only 4 lines:
Or you take the demo example Example_MA_H1.ded as a template, copy the whole branch in it, change paths to input and output files in your terminal,
read and print the deductor helper there's a russian detailed description of where to click....
there, that's why it didn't work, I was highlighting all the lines there, thank you very much, all shut up now
Thanks again
But then why do you need MA if you have an OHLC forecast? ;)
The MA is no more than an example.
Here, a glimpse into the future :))
The picture was obtained using a script ;)