[WARNING CLOSED!] Any newbie question, so as not to clutter up the forum. Professionals, don't go by. Can't go anywhere without you. - page 724
You are missing trading opportunities:
- Free trading apps
- Over 8,000 signals for copying
- Economic news for exploring financial markets
Registration
Log in
You agree to website policy and terms of use
If you do not have an account, please register
Which one?
Trend
1 point - e.g. bar 5 = price 1. // + horizon line 1
2 point - bar 1 = price 2. // + horizon line 2
projection 3 point - intersection of lines
Maybe that makes more sense :)
Hello!
Please explain this -
why during testing a lot of errors appear in the logbook???? (I have 269 - I don't know what to think anymore) .
what is the "genetic algorithm" checkbox, what does it do and how does it affect the results?
I've already asked about inconsistency of results - my story starts in January 2010, I'm testing code from February to July. I'm observing a formidable idiocy - the results change frequently and significantly, even with the internet turned off. Suppose the tester showed 5000 for 5 months, when tested again this is 2000, then 6000, etc. in the code do not change anything.
Tell me whether the tester may malfunction and glitch? What results should we trust?
Thank you!
Trend
1 point - e.g. bar 5 = price 1. // + horizon line 1
2 point - bar 1 = price 2. // + horizon line 2
projection 3 point - intersection of lines
Maybe that makes more sense :)
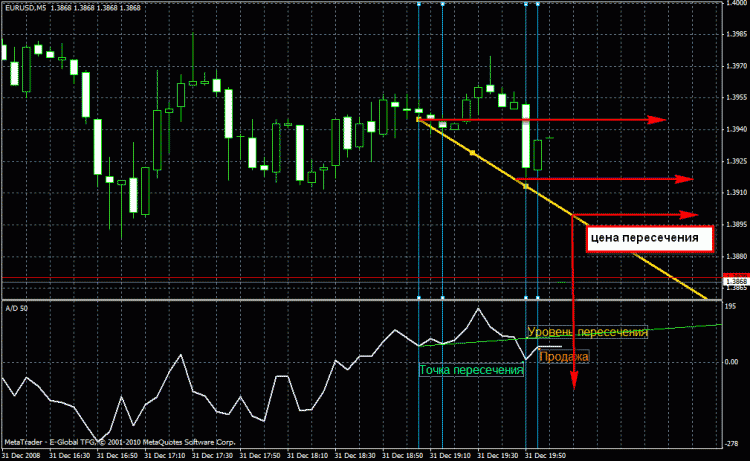
It's more trivial. I need to look at the intersection of the trendline, plotted on the indictor chart, with the line of this very indictor... The price doesn't match what's in the indent window at all.
Trend lines are plotted against the last two extrema, whereby if the last but one lower extrema is below the last one, an uptrend line is plotted and if the last but one upper extrema is above the last one, a down trend line, respectively, is plotted. Further, using the straight line equation, points of intersection of the trend lines projections are calculated for 1 bar. And when the indicator line value crosses the value of the trend line projection on the given bar, a decision to buy/sell will be made. I need to mark these points of projections on the price chart. But the price data and probable points of intersection (projections of the trend line on 1 bar) do not coincide (tester log):
EURUSD,M5: PreLastTimeUP = 14 PreLastVarUP = 105.3325 LastTimeUP = 11 LastVarUP = 74.8325 y = -26.8342 Ask = 1.387
As we see, y (calculated point of intersection on the indicator chart) and Ask price are completely different. How can I know in advance that at this (calculated) point of the indicator the price will be equal to the value it became equal to later ... ??? And how do I put a mark at this expected chart point???
The trend lines are based on the last two extrema
Which correspond to the price points...
That's how I see it - or don't understand it (
Setting SL and TP to zero -- doesn't work, no orders are placed.
Or is it evening and fatigue?
Which correspond to the price points...
Well, that's how I see it - or don't understand it ((
Looks like either I don't get it... or I don't get it.... Mess... :)
Or the indicator is lying because the trend has changed on bar 4. And nauvsikdku, if you draw the trend on 2-3 (count) right peaks, the price will be very close to crossing on 1 bar.
Gotta go, I'll check back tomorrow.
I wonder if there are "old-timers" here on the forum from the beginning of the forum, who have they helped... Do they have any profitable strategies or advisors?