SOT
Since you are beginning to try to understand the material, and with such an approach as "I haven't found anything intelligible on the subject", I think it would be appropriate to introduce definitions in the water part, which will be used in the future, give a brief overview of existing (main) views and express your position on these views. You may stick to a particular point of view or propose your own. This is to provide certainty, so that there is no ambiguity in the perception of terms and material in general. With this kind of preparatory work, even a beginner will grasp the subject at a glance.
All in all, a good attempt, a necessary one. I applaud your initiative.
To find out all of the above it is enough to type in a search engine "SOT reports", the points of view mentioned, they mainly boil down to arguments in which everything gets lost. I have simply provided data on the positions of the two main groups of participants since the beginning of the current September futures contract, I think you can see who did what, and I suggest, based on the actions of the participants in these groups, to draw your own conclusions.
I'm not claiming anything, I'm suggesting that we work together to figure it out.
The basics are here
- clusterdelta.com
Conclusions can be drawn)
Basically they write that commercial traders have the leading role in this analysis and should look for extreme values for entering. I tested this idea and received very few entries.
Yes, they often indicate the direction well, but with drawdowns of about 500 pips, which is very much. For example, having a deposit of $100 and opening with 0.02 lots at 500 points drawdown the account will go to zero. Testing period 1995 till now.
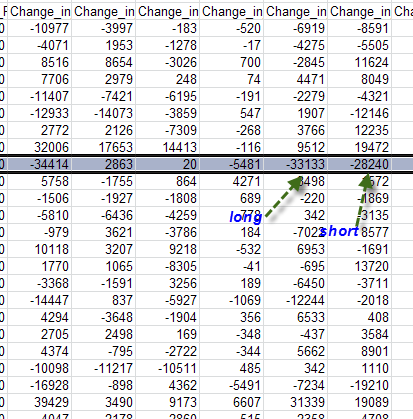
While looking closely at the commercials. The picture below is Long-Short.
I assume that on a weekly scale there are no prevailing trends for the pound right now (meaning trends such as those from 2013 July to 2014 July. or September-October 2011)
This is basically what the price chart shows.

They mostly write that commercial traders have the upper hand in this analysis and need to look for extreme values to enter. I have tested this idea and received very few entries.
Yes, they often indicate the direction well, but with drawdowns of about 500 pips, which is very much. For example, having a deposit of $100 and opening with 0.02 lots, with a drawdown of 500 pips, the account will go to zero.
While looking closely at the commercials. The picture below is Long-Short.
I assume that on a weekly scale there are no prevailing trends in the pound at the moment (I mean the trends such as from 2013 July to 2014 July. or September-October 2011)
This is basically what the price chart shows.
As we can see in the example of the current contract, there was almost no drawdown, they were close to 1.58, close to 1.54, set of 1.5620-30 + short selling at 1.5870 and almost 3000 long contracts at 1.5520-30, so the drawdown of shorts will start at 1.5670-80.
I mean the drawdown on history since 95, not the current time. The 500p drawdown is not as bad for commercials as it is for physicists, they have much smaller leverage.
There is another point here, considering their volumes and market capacity, they cannot exit and enter at once, but do it gradually (July 2013 to June 2014, the long-short was shrinking).
I assume that during this period they were gradually closing longs even though the currency was growing. It is true that they expire every quarter, but there are also long contracts, for other years, if I am not mistaken.
old, tell them that 2+2=4 =)) it's the basics ....... (although they probably don't even know that 2+2=4) well, those who do know are too lazy to mark where things go...
Why have I decided to look at it "contract by contract". At the end of a contract, there is usually a big lock-in and the opening of new positions on a new contract. As was the case with the June contract.
The merchants alone fixed more than 60,000 positions
I mean the drawdown on history since 95, not the current time. The 500p drawdown is not as bad for commercials as it is for physicists, they have much smaller leverage.
There is another point here, considering their volumes and market capacity, they cannot exit and enter at once, but do it gradually (July 2013 to June 2014 the long-short was shrinking).
I assume that during this period they were gradually closing longs even though the currency was growing. It's true that they expire every quarter, but there are also long contracts, for other years, if I am not mistaken.
These are the key words, I doubt that they even have big drawdowns, but I could be wrong)
old, tell them 2+2=4 =))) it's the basics ....... ( although they probably don't even know that 2+2=4 ) well, those who do know are too lazy to mark what goes where...
Zogman recently asked a question like, how is it that one sold, the other bought, so the total must equal zero)
If one has a new purchase and the other a new sale, then clearly not zero, but 1+1)))
I.e., OI +2
- Free trading apps
- Over 8,000 signals for copying
- Economic news for exploring financial markets
You agree to website policy and terms of use
So, let's begin).
I've read and reviewed a lot of stuff on the net about SOT reports, articles, forums, "ts", etc.
It mainly comes down to arguments about who are the NonCommerce, Commerce, which of them rules the market, which reports are better to watch, standard, futures only, combined or new financial. They mainly look at last week figures and who added or subtracted what, so I haven't found anything clear on this topic. That's why I decided to try and understand it myself, the key word being try. I will not describe what a report is, where they "live" etc. I will not describe it, there is enough information and it's easy to find.
The June contract was expired on 16.06 and by the time of expiration the NonCommerce (NK) moved with a net sell position 25434 contracts and the Commerce (K) moved with a net long position 25547 contracts.
Let's first analyze the NK positions from the beginning of the current contract
In the first week of September contract the Oil companies added 17653 to long and 14413 to short and their net position was 22194 short
i.e. it turns out that they sold 14413k and then bought 17653k. Since at futures one position is closed by opening the opposite one, we have the net balance as long by 3240k from 1.5710-20
Adding 2126k to long from 1.57 and fixing shorts by 7309k at the same price, the net short position is 12759k
30.06-07.07
We have fixing shorts at 14073k and shorts at 3859k, a net position of 22973k in shorts.
Etc.
As a result on 12.08 we have the following picture:
Now let's get to the bottom of this mess)
The NKs have grown the longs from the beginning of the contract by 7874k and cut the shorts by 7184k.
We can see their main purchases with the average price at 1.5530-40.
Now let's apply the commercialso(K) positions to the same chart
We have the following picture
In the first two weeks they sold 18429k with the average price about 1.58, in the next two weeks almost 16300 of them were closed with the average price 1.54, the remaining shorts at 1.58 were 2130k, then there was a buyers' fix and set of 1.5620 shorts, and the last two weeks, 28.07-12.08 were less than 3000k from 1.5520.
Since the beginning of the contract the traders set shorts by 20817k and longs by 3338k, i.e. 17,479k were set as shorts at the average price of about 1.57.
Conclusions can be drawn)