Rate of price change - page 3
You are missing trading opportunities:
- Free trading apps
- Over 8,000 signals for copying
- Economic news for exploring financial markets
Registration
Log in
You agree to website policy and terms of use
If you do not have an account, please register
But there is another way, just look at this graph from a different angle. And if you present it as a Renco chart, you get that speed= number of bricks per hour, as a brick is nothing else but the distance travelled in ticks, by adjusting the size of the brick you get the analog of cm, km, miles ..... something like this.
1. I don't see the connection. So the championship leaders are the best programmers?
2. I had my own tasks, I do not trade on ticks, there is too much information.
3. Believe.
You may write a tester for your own strategy. And the interesting thing is the tester has ticks, i.e. it has all information and the output may have a result - everything depends on the program being tested.
4. If you run it through the tester, taking into account the costs of trading, I am sure there is no profit to talk about in such a strategy.
1. Not necessarily the best, but they just know how to program and know MQL, there is no other way to enter the championship. They just know how to do it, that's all, the link is just for this purpose... I want to show you what I can do and for a long time.
You may trade on ticks, but no one is asking you to do it. You may trade on the cunning bars called Renko, but do it "right".
3) You should believe it, the code is in the public domain for almost 9 years.
4. That's what I did, wrote my own tester. I hope I do not need to explain how much work it is, how much effort and time was spent ... I hope I don't need to explain how much effort and time I put into it and the ToR takes only two lines.
5. Sure? I mean, even without testing it, you're sure. Great. Sure you can't enter costs in the ninzi tester ...
Then once again go to the link ... look at the test result net profit $144100 with the number of transactions 18850, if you take the commission of $ 5 (this is a double commission, and draconian). Then, using first-class mathematics get 144100 - (18850 * 5)=144100-94250 = 49850 $ in dry residue ...
50 tons of green, no indicators, no optimization, 1 lot, without any averaging, peresidok and matrigalov etc. etc ...
I'm not saying that this is a perfect trading system, there are better ones (screenshot below).
Can you post a similar one + post the idea + show a video how to write such a code of advisor and test it....
At least something similar in characteristics ?
These screenshots and robot for thought, there's an idea there. It needs to be finished as a fighting robot. A screenshot of the battle robot below.
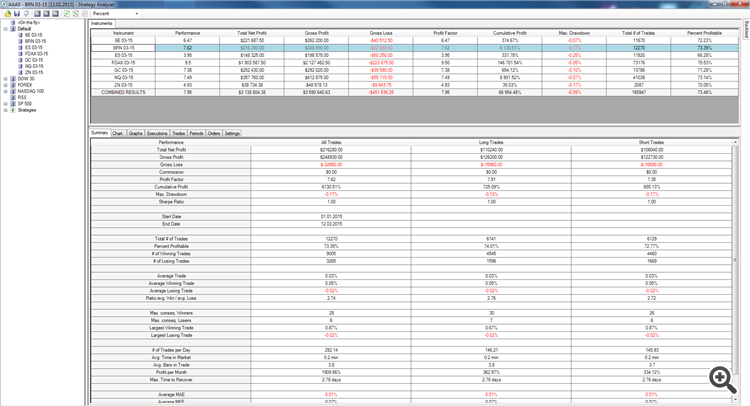
The results 1 lot, for various instruments futures CME (EUR / USD, Oil, miniS & P500, Dax, Gold, Bonds ...) the maximum drawdown of hundredths of a percent, the profit factor of 4 and above. Total net profit over 3 million (including fees).
Z.U. The path to divide by time is speed. Not density. Physics textbook I do not remember what grade. But I remember exactly what speed is :-) km/h.
Z.U. The path divided by the time is the speed. Not density. I can't remember which grade in physics textbook. But I remember exactly what speed is :-) km/hour
Speed is not a path in a fixed hour, speed is a fixed distance in the time it takes to cover it. )
Sergei, can you tell me by what criteria this very fixed distance between lower and upper faces of bricks should be chosen in renko-graphs?
The results are impressive...
Speed is not a path in a fixed hour, speed is a fixed distance in the time it takes to cover it. )
Sergey, can you tell me by what criteria this very fixed distance between lower and upper edges of bricks should be chosen in renko-graphs?
The results are impressive...
A brick is just that - a fixed distance. The size of the brick is fixed. As for the choice of its size...
If we take candlesticks as an analogy, there are some who prefer 5-minute candlesticks, and others who only trade on the hours.)
Brick allows you to make more fine-tuning, you pick the one you like ...
Although, there is a quite famous dissertation by Shiryaev (search the old forum somewhere), he connects brick size with H-volatility, from memory 1.4 spread seems to be obtained.
1. Not necessarily the best, but they just know how to program and know MQL, you can't get to the championships any other way. They just know how to do it, that's all, the link is only for this purpose... to show you what I know and how long ago I did it.
You may trade on ticks, but no one is asking you to do it. You may trade on the cunning bars called Renko, but do it "right".
3) You should believe it, the code is in the public domain for almost 9 years.
4. That's what I did, wrote my own tester. I hope I do not need to explain how much work it is, how much effort and time was spent ... I hope I don't have to explain how much work I spent and how much time and effort I spent... while the ToR takes just two strings.
5. Sure? I mean, even without testing it, you're sure. Great. Sure you can't enter costs in the ninzi tester ...
Then once again go to the link ... look at the test result net profit $144100 with the number of transactions 18850, if you take the commission of $ 5 (this is a double commission, and draconian). Then, using first-class mathematics get 144100 - (18850 * 5)=144100-94250 = 49850 $ in dry residue ...
50 tons of green, no indicators, no optimization, 1 lot, without any averaging, peresidok and matrigalov etc. etc ...
I'm not saying it's a perfect trading system, there are better ones (screenshot below).
Can you post a similar one + post an idea + show a video how to write such an EA code and test it....
At least something similar in characteristics ?
These screenshots and robot for thought, there's an idea there. It needs to be finished as a fighting robot. A screenshot of the battle robot below.
The results 1 lot, for various instruments futures CME (EUR / USD, Oil, miniS & P500, Dax, Gold, Bonds ...) the maximum drawdown of hundredths of a percent, the profit factor of 4 and above. Total net profit over 3 million (including fees).
Z.U. The path to divide by time is speed. Not density. Physics textbook I do not remember what grade. But I remember exactly what speed is :-) km/h.
2. Who sets the benchmarks? You? That's how I count as I need to. For me the error is ticks, a one minute chart is enough for me. A one-minute bar consists of ticks. The calculation error lies in the spread area and is quantitatively small, I even count it.
3) It is not a problem at all.
5. Maybe they made a mistake in the algorithm, or your tester gives out a weird one, or you have a different strategy. Illusions. How do I check you? I prefer a real-time statment.
Speed is not a path in a fixed hour, speed is a fixed distance in the time it takes to cover it. )
Sergey, can you tell me by what criteria this very fixed distance between the bottom and the top edge of the bricks should be chosen in renko-graphs?
The results are impressive...
A brick is just that - a fixed distance. The size of the brick is fixed. As for the choice of its size...
If we take the standard candlesticks as an analogy, then there are those who prefer 5-minute candlesticks, and those who only trade on the hours.)
Brick allows you to make more fine-tuning, you pick the one you like ...
Although, there is a quite famous dissertation by Shiryaev (search the old forum somewhere). He connects brick size with H-volatility, from memory it seems to be 1.4 spread.
I'll tell you a secret, all charts are the same, it's just that the older ones come with a loss of information and the tick history is the most accurate. The more accurate the history is, the shorter it is as a rule.
That is, by selecting charts you select the accuracy of ticks.
Small brick sizes are noisy, but large ones are very consistent from year to year.
And then there's the problem with testing small bricks, because possessing a deep(tick or even minute) is difficult.
And on higher timeframes the error simply grows. I've now taken a 100,000-bar minute chart. The minimum optimum brick is 30 old pips, and if you widen the range, the total is greater. Out of 100,000 bars, only 275 can give an error in the postic timing.
Essentially this proves that you can only win on the Eurodollar if you take more than 30 pips on average in a single trade.
I'll tell you a secret - all the charts are the same, just older ones are losing information, and the tick history is the most accurate. The more accurate the history is, the shorter it is as a rule.
That is, by choosing the charts you select the accuracy of ticks.
The size of the small bricks is noisy, but the large ones are very consistent from year to year.
And there's also the problem of testing small bricks, because possessing a deep(teak or even minute) is difficult.
And on higher timeframes the error simply grows. I've now taken a 100,000-bar minute chart. The minimum optimum brick is 30 old pips, and if you widen the range, the total is greater. Out of 100,000 bars, only 275 can give an error in the postic timing.
Essentially this proves that you can only win on the Eurodollar if you take more than 30 pips on average in a single trade.
Now I'll tell you the secret. The tick story is not the most accurate. There are more accurate and better ones. Here's a link to the tick story watch the video there it shows how to download and play it...
You're confusing the concepts. By choosing the size of the brick (and the rules for building it too, by the way) I am in no way affecting the accuracy of the ticks. And what is tick accuracy anyway .... Is it accurate and not accurate? It's in the forex kitchens everything is inaccurate. On the stock exchange, on a real exchange, all ticks are the same for everyone. And the story is the same for everyone, because behind every tick there is a real buy/sell transaction.
And the statement of 30 points ... is not for me.
Z.Y. Also, the fact that you have repeated the algorithm and were impressed with the results is good. You have something to think about. The differences may have arisen if you were testing with another symbol or a different testing period, but you will still make profit.
I do not think you will be able to duplicate the battle algorithm (the screenshot below). It differs from the one that I have used as a training one. But the idea is the same as in the training video.
TimeCurrent() is measured in seconds, so
I don't think this code will work
....................................................................................................................
datetime start = TimeCurrent();
double startPrice = SymbolInfoDouble(_Symbol, SYMBOL_BID);
datetime finish = start + 10;
if (TimeCurrent() > finish)
{
double finishPrice = SymbolInfoDouble(_Symbol, SYMBOL_BID);
Print(" price has changed by ", finisPrice - startPrice," pip;)
}
..............................................................................................
At every tick we will be updated with the current price state and we never have to wait for the Print.
If you don't know something, don't get clever!
Speed is the change in distance per unit time! Not the other way round.
v = dx / dt.