Thank you.
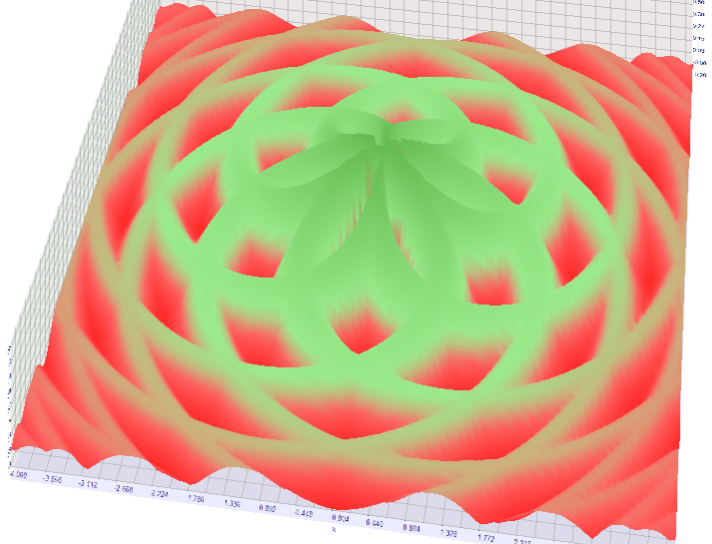
Beauty is a formidable force.
Beautiful!!!
But I think it would be good to add a selection of Z-axis values. So that in addition to the result one could see in 3D profitability, drawdown, total trades, etc.
MetaDriver:
Vladimir, what's your contraceptive function? :o)
That's useful.
MetaDriver:
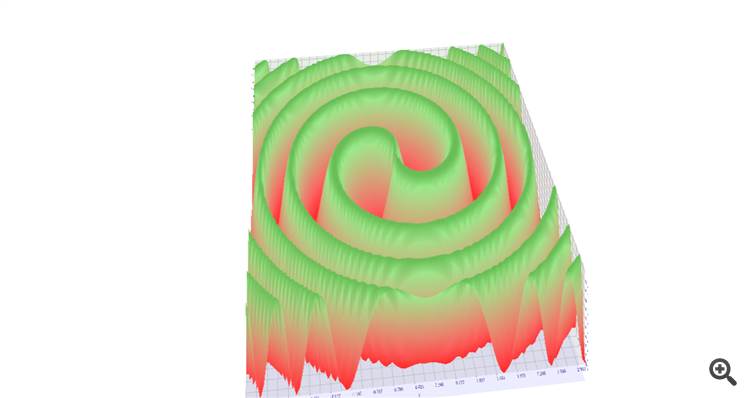
I see, thank you. That means Arctan() is doing a spiral wrapping.
:)
f(x,y)= Sin(x^2+y^2+Arctan(x/y))^2
MetaDriver:
This one is even more interesting. You can test the gradient lift on it. You should also attach the function formulas.
Nah. I'm doing this. Through him. ;-)
Here's more Asmenoh :
;-)
Urain:
This one's even more interesting. We can test the gradient lift on it. You might as well attach the function formulas.
This one's even more interesting. We can test the gradient lift on it. You might as well attach the function formulas.
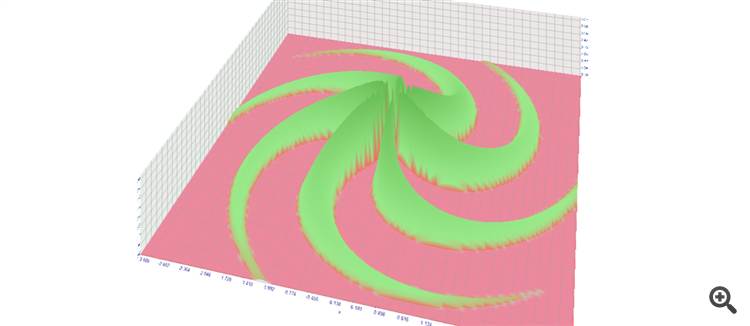
Hang on, hang on. I've got another "rendering" coming up. Screwball :)
Oh, yeah:

And the source code of both of them:
Files:
Screw-2.mq5
1 kb
DoubleScrew.mq5
1 kb
You are missing trading opportunities:
- Free trading apps
- Over 8,000 signals for copying
- Economic news for exploring financial markets
Registration
Log in
You agree to website policy and terms of use
If you do not have an account, please register


In the latest 419 build we have included a new 3D visualisation mode for test results.
Here is a short video showing how the tester works:
Just set the "Math calculations" mode for playback so that historical data is not transmitted and run the next Expert Advisor for the test with limits from -3.00 to 3.00 in increments of 0.025:
Below are some visualisation options for math calculations: