MetaTrader 5 Strategy Tester 3D Visualization
I can not understand how this tool can be higher than the simple visual tester on a priority list for developpers ...
In order:
you create an EA, WATCH if it does what you want it does on the visual tester,
THEN,
you may think to optimise it parameter with the optimizer, but you can't even think to use this tool if you are not sure your EA does what it is supose to do on a chart live in the backtester !
Does the 3D visualization only work in "Math calculations" mode ?
Can it work in "1 minute OHLC" mode? Can it be used to show results of an Expert Advisor testing?
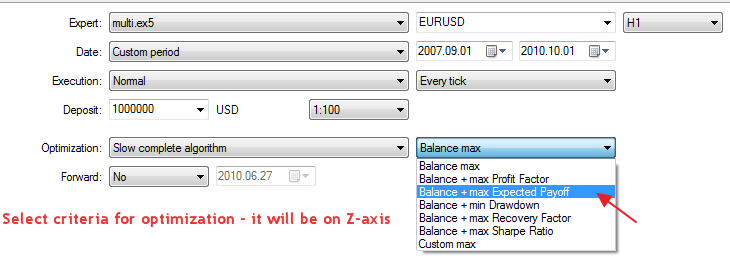
Can you add "Z-Axis" to select different testing result? such as Balance,Total Net profit ,Expected Payoff ,Recovery Factor,Sharpe Ratio,etc.
Does the 3D visualization only work in "Math calculations" mode ?
Can it work in "1 minute OHLC" mode? Can it be used to show results of an Expert Advisor testing?
Can you add "Z-Axis" to select different testing result? such as Balance,Total Net profit ,Expected Payoff ,Recovery Factor,Sharpe Ratio,etc.
Definitely, it works for other testing modes too :)
You should try it.
Thanks Rosh,
Can you help add "Z-Axis" to select different testing result? such as Custom Max,Balance,Total Net profit ,Expected Payoff ,Recovery Factor,Sharpe Ratio,etc.
You have two ways:
- first - select one standard criteria before an optimization;
- second one - return via OnTester your own result (it may be total profit, recovery factor, etc.)
You have two ways:
- first - select one standard criteria before an optimization;
- second one - return via OnTester your own result (it may be total profit, recovery factor, etc.)
Rosh,
Is it possiable that we select different result (it may be balance max,custom max,total profit, recovery factor, etc.) as Z-axis after an optimization?
- www.mql5.com
- Free trading apps
- Over 8,000 signals for copying
- Economic news for exploring financial markets
You agree to website policy and terms of use
In the latest build 419, we have included a new mode of 3D visualization of testing results.
Here is a quick video showing how the tester works:
To play it, set "Math calculations" mode to prevent transmission of historical data, and start testing of the following Expert Advisor with limits -3.00 to 3.00 and step equal to 0.025:
Here are some variants of visualization of mathematical calculations: