Machine learning in trading: theory, models, practice and algo-trading - page 858
You are missing trading opportunities:
- Free trading apps
- Over 8,000 signals for copying
- Economic news for exploring financial markets
Registration
Log in
You agree to website policy and terms of use
If you do not have an account, please register
I do not use other people's algorithms.
Of course, the Kulibin spirit is a good thing, but the most interesting and necessary things have already been invented and are lying on the palm of my hand. I would not refuse the results of decades of research around the world.
I have those too, there are also those who earn but not always, and I want to always (or almost always). And only then I will be able to give out advice.
In the piggy bank! I will insert it every time you start to give out tips where you do not understand :)
Of course, the Kulibin spirit is a good thing, but the most interesting and necessary things have already been invented and are lying on the palm of my hand. I would not refuse the results of decades of research around the world.
Report? You're killing me here with your empty assertions.
In the piggy bank! I'll put it in every time you start giving advice where you don't know it :)
I've learned it's useless to ask a dead horse to say something intelligible, it's easier to get off and not react
After 2 minutes of working with 13x6400 matrix (10 times bigger than the example)
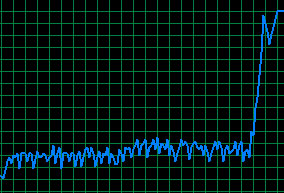
The following happens
Error: I can't place 3.2 Gb vector.
And it's trying to take 12-13 Gb, while I have a total of 16 Gb
R usually takes up memory in chunks a little at a time. He's already taken 12-13, wants 3 more, and who knows how many more will be needed later.
Reduced the matrix - even 13x500 could not count... Apparently market data without a pattern drives him crazy.) It's not like you use glucose to determine diabetes.
Has anyone tried with market data? Any luck?
Finally... I've managed with 13x100: (but it's silly to sift something out by 100 lines). Something input #2 appeared to be the most important, on previous packages it was in the end. Probably, this is because I evaluated it on 100 lines, not 6400.
Ordered variables (decreasing importance):
2 5 10 12 64 7 8 9 1 11
Scores 0.24 0.025 0.019 -0.048 -0.055 -0.057 -0.05 -0.063 -0.067 -0.072
3
Scores NA
---
Matrix of scores:
2 5 10 12 64 7 8 9 1 11
2 0.24
5 0.128 0.025
10 0.186 -0.002 0.019
12 0.015 -0.043 -0.051 -0.048
6 0.086 -0.053 -0.011 -0.068 -0.05
4 0.066 -0.029 -0.073 -0.054 -0.065 -0.055
7 0.134 -0.088 -0.101 -0.188 -0.121 -0.099 -0.057
8 0.12 -0.202 -0.069 -0.1 -0.068 -0.089 -0.061 -0.05
9 0.092 -0.004 -0.138 -0.097 -0.088 -0.069 -0.112 -0.088 -0.063
1 0.086 -0.06 -0.088 -0.107 -0.083 -0.084 -0.066 -0.081 -0.076 -0.067
11 0.095 -0.017 -0.183 -0.115 -0.083 -0.078 -0.066 -0.086 -0.066 -0.082 -0.072
3 0.059 -0.132 -0.102 -0.146 -0.114 -0.126 -0.109 -0.113 -0.131 -0.117 -0.135
Hi!
Is the neuro robot with AI ready?
Give it a try. )))
Meanwhile I found out how to make a tick bot - to make it work as well as on the tester)))
An Introduction to Greta
I was surprised bygreta. I had assumed that thetensorflow andreticulate packages would eventually enable R developers to look beyond deep learning applications and exploit theTensorFlow platform to create all manner of production-grade statistical applications. But I wasn't thinking Bayesian. After all,Stan is probably everything a Bayesian modeler could want. Stan is a powerful, production-level probability distribution modeling engine with a slickR interface, deep documentation, and a dedicated development team.
But greta lets users write TensorFlow-based Bayesian models directly in R! What could be more charming? greta removes the barrier of learning an intermediate modeling language while still promising to deliver high-performance MCMC models that run anywhere TensorFlow can go.
In this post, I'll introduce you to greta with a simple model used by Richard McElreath in section 8.3 of his iconoclastic book:Statistical Rethinking: A Bayesian Course with Examples in R and Stan. This model seeks to explain the log of a country's GDP based on a measure of terrain ruggedness while controlling for whether or not the country is in Africa. I am going to use it just to illustrate MCMC sampling with greta. The extended example in McElreath's book, however, is a meditation on the subtleties of modeling interactions, and is well worth studying.
First, we load the required packages and fetch the data. DiagrammeR is for plotting the TensorFlow flow diagram of the model, and bayesplot is used to plot trace diagrams of the Markov chains. The rugged data set which provides 52 variables for 234 is fairly interesting, but we will use a trimmed-down data set with only 170 counties and three variables.
Here is the code on how to use it.
Hello bicycle inventors!
)))
For the first search, it is advised to use either "peng" (faster) or "esteves"
(more reliable but much slower for large datasets) and, in case the number of
variables is large (>100), restrict the "forward" search to "n.var = 100." The
progress bar will give you an idea of the remaining run time.
library(varrank)
data(nassCDS, package = "DAAG")
nassCDS.varrank <- varrank(data.df = nassCDS,
method = "peng",
variable.important = "dead",
variable.method = "dead", variable.method = "sturges",
algorithm = "forward",
scheme = "mid",
verbose = FALSE)
summary(nassCDS.varrank)
plot(nassCDS.varrank, notecex = 0.5)
This particular algorithm, does it select predictors good or bad?
In general, in selecting predictors, what is good and what is bad?
On the surface, it lies in linking predictor selection to the performance of a model.
That sounds like a second step to me.
The first step is ALWAYS to deal with model overtraining, a situation where the model's behavior in the future does not match its behavior in the past. If we don't have any thoughts on that, then it's all a numbers game.
To return to your post.
My point is that the behavior of the model in the future will be little different from the behavior on historical data if the PRESCRIPTION OF the predictors as the window moves will change little.
These are the ranks that the package computes, will they change on some set of predictors or not? Clearly, the result may be different for different sets of predictors, nevertheless, if (as I did above) there were posts like this posted here...