
You are missing trading opportunities:
- Free trading apps
- Over 8,000 signals for copying
- Economic news for exploring financial markets
Registration
Log in
You agree to website policy and terms of use
If you do not have an account, please register
The main thing is simple and clear, and through the BR can be achieved invariant to the time frames, you can find a pattern on the daily and apply it to the minute
What is the pattern in the picture? @mytarmailS
Answer: 'battery died' patternNot a bad idea, especially the knowledge base
Thanks, we are growing slowly.
Listen, you seem to know about DSP, is it possible to curve the horizontal and vertical scale through the spectrum?
Is there even one statistical proof that there are any patterns on the price chart?
Is there even one piece of evidence?
It's all a matter of misunderstanding...
How does machine vision work? They probably retrain the tesla every second? There are more market patterns...
Or don't they have all that?
There are fewer patterns there, because the SB component is smaller. Although maybe the numbers are close to each other)))
There are fewer patterns there, because the SB component is smaller. Although the numbers may be somewhere around there)))
Tesla's machine vision has patterns. For example, a set of geodesic signs that means turning left. Or right. Or crosswalks.
They're easy to identify.
Where are the patterns in the marketplace?
In the imagination?
What's the pattern in the picture? @mytarmailS
Answer: the 'battery died' patternthe question was, does tesla constantly retrain for new twists and turns?
I know that, you know that... But since you initially blurted out YES, because you have no idea how it happens.
Now you have two choices.
1) Admit you're wrong and actually admit that you have no idea how machine vision works, so go and read about it and get smarter
2) To start jumping from topic to topic, turn the tables, leading the conversation to absurdity and sort of come out the winner of the dispute, but we both know how it is in reality)))
Since you chose the second way, I am not interested in absurd conversation...
There are fewer patterns there, because the SB component is smaller. Although maybe the numbers are somewhere around there)))
come on, stop it...
Most of the time it is like in the first picture, i.e. the forecast is almost horizontal line.
Sometimes as in the second picture...
mytarmailS
Make pictures like this, not hand-drawn ones.
My pattern finder was not able to identify a typical double top, because in the last year in the 20 most similar cases the price both worked the double top pattern and flew further up.
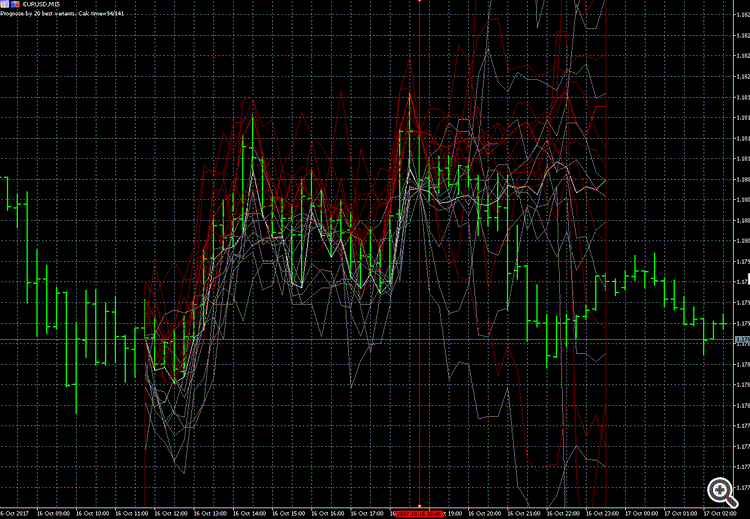
The forecast is bold red (high) and white (low) lines, gray and dark red variants from the history
And the most similar variants are not so similar.
And sometimes it predicts in one direction and the price goes in the opposite direction.So it turns out 50/50, like with the coin
.
The question was, does TESLA constantly retrain for new twists and turns?
I know that, you know that... But since you initially blurted out yes because you have no idea how it happens.
And now you have two choices.
1) admit you're wrong and actually admit that you have no idea how machine vision works, so go and read up on it and get smarter
2) To start jumping from topic to topic, turn the tables, making the conversation absurd, and sort of come out the winner of the dispute, but we both know how it is in reality)))
Since you chose the second way, I am not interested in absurd conversation...