Machine learning in trading: theory, models, practice and algo-trading - page 1929
You are missing trading opportunities:
- Free trading apps
- Over 8,000 signals for copying
- Economic news for exploring financial markets
Registration
Log in
You agree to website policy and terms of use
If you do not have an account, please register
in continuation of a personal conversation
your option
plain variant
As you can see the values are quite different, you can check yourself
I have in my model
because I have only one column, but it doesn't really matter.
===================UPD
Man, they are different every time you run umap_tranform, it shouldn't be the same
Wasn't paying attention. It's been a long time...
in continuation of a personal conversation
your option
plain variant
As you can see the values are quite different, you can check yourself
In my model
because I have only one column, but it doesn't really matter.
===================UPD
They are different every time you run umap_tranform, it shouldn't be that way
Usually for repeatability they set the Seed (of the built-in HSS) to some value. If not, then random is taken. Perhaps in this package Seed is also - check it.
Yes I think so, but the point is that without RMS it should always be the same, in the package analog "umap" always the same result
Especially for you, with only one hope that you will learn r-ku)
there are two functions
get.indи
get.targetthe first creates a date set of indicators, the second the target of the zigzag
all you need to do is load the data with the closing price of 10k and write it in the variable clos
and get your umap with the target
https://github.com/jlmelville/uwotEspecially for you, with only one hope that you will learn r-ku)
there are two functions
и
the first creates a date set of indicators, the second the target of the zigzag
all you need to do is load the data with a close price of 10k and write it in the variable clos
and get your umap with the target
https://github.com/jlmelville/uwotVery nice, thanks!
I wish more comments :)
The question here is how to synchronize the predictors from the file with the obtained target?
Very nice, thank you!
I wish more comments :)
The question is how to synchronize the predictors from the file with the target?
Well, since the target is built on the price, it is already synchronized, and if the predictors are built on the same scene, it means they are too)
Or maybe I did not understand your question?
I tried to name the variables so that they were understandable without comments
A question from a beginner.
There are three variables A, B, C. Some condition is handwritten from them. For example.
I want to reproduce this condition automatically. I don't need to find it, because I already know it. But I need to have for example a dozen of some weight coefficients, a certain combination of which is able to hit this condition with high probability, when I set A, B, C there (polynomial or HC - I don't know, because it's zero) and get the original condition.
I am interested in what kind and how many input weighting coefficients the desired function has, so that such original conditions can be reproduced via weights?
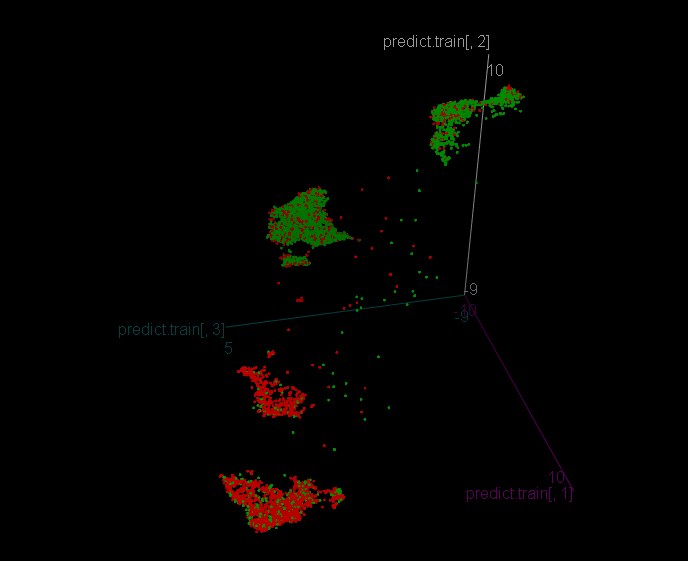
So, how to train trees by clusters, I tell and show you.
We got the following model for class recognition
The history is accurate enough Accuracy 0.9196756 - i.e. the logic of the cluster is quite reproducible.
Next I trained for each cluster on the model
Cluster 1
Cluster 2
Cluster 3
Cluster 4
All clusters have Accuracy 0.53 or so.
And this is how the model looks like without splitting into clusters
Accuracy 0.5293815 is about the same as the clusters.
If we compare the models for clusters and one tree model with the entire sample, we see that the cluster trees have more leaves with generalized sample information with a target of 1 and -1, which is theoretically good.
Let's see what the tests show - first, let's look at the training period
Model without cluster partitioning:
Model with clustering:
We see that the accuracy is better with the model without clustering, but the trades are higher with the model on clusters, which allows for better financial performance.
Now let's look at the sample outside of training.
And here are our clusters:
And the model without clusters:
The situation here seems to be reversed - a lot of trades had a detrimental effect when the market started convulsing since April.
I decided to look at the leaves from the cluster models individually, had there been no cluster, on a descending histogram:
A total of 6 unprofitable leaves (zero target removed - it's a barrier to entry), it turns out that we are not in the right cluster?
Well, since the target is built on price, it is already synchronized, and if the predictors are built on the same stage, then they are too)
Or I have not understood the question.
I tried to name the variables so that they were understandable without comments
How to take my dataset with predictors and close price and load it by specifying the column with close price instead of using the variant of indicators generation in R?
As I understand it, since the target is ZZ tops, then the predictor part of the sample should be filtered out, here, and so to feed the predictors you have to filter out the table with the predictors as well, or what?
A question from a beginner.
There are three variables A, B, C. Some kind of condition is made up of them by hand. For example.
I want to reproduce this condition automatically. There is no need to find it, because I already know it. But I need, for example, to have a dozen of some weight coefficients, a certain combination of which is able to hit this condition with high probability, when I set A, B, C there (polynomial or HC - I don't know, because I don't know) and get the original condition.
I am interested in what kind and how many input weights the desired function has, so that such original conditions can be reproduced via weights?
as an alternative
The input of NS is values A,B,C n times (let's say 1000), the output is answers of your formula for these values as 0;1. You should try it. And see the classification error, how well the model reproduces the condition.
If you need to see exactly what kind and interpret it, then through trees
Variant 2 (if the first one worked badly) - A, B, A-B, C, A+3*C, 2B - variables, all the same as in the first variant to put in the tree. And you can see its structure as in Alexey's pictures above