Indicators: DRAW_BARS
Maybe it would be better to create an "examples" section? А... then... this looks like spam....
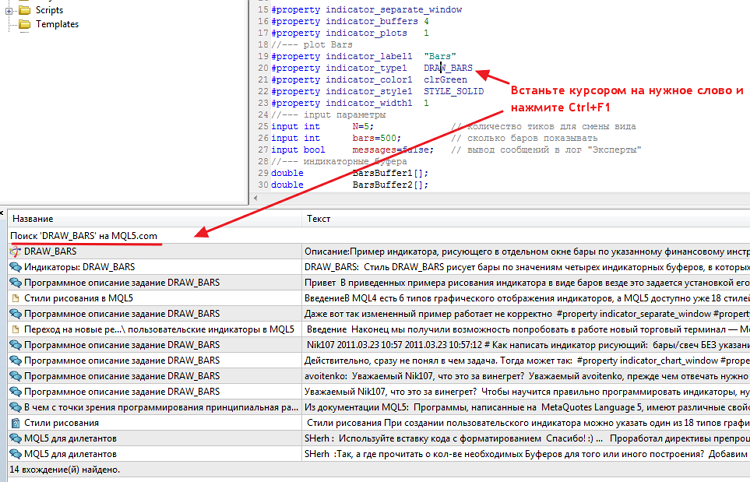
Not everyone remembers and knows how to use this or that drawing style. We have built in MetaEditor 5 a search for the entire MQL5 website directly from the code. To do this, just stand on the desired word and press the combination Ctr+F1. All found matches will be shown - articles, documentation, forum, Codebase and so on. Therefore, we fill Codebase with examples for different aspects of the MQL5 language.
Документация по MQL5: Стандартные константы, перечисления и структуры / Константы индикаторов / Стили рисования
- www.mql5.com
Стандартные константы, перечисления и структуры / Константы индикаторов / Стили рисования - Документация по MQL5
Dear ,
is there possibly to plot a "Constant Bar", "Range Bar" or "Range Candle" every X pips instead of N ticks ?
Best Regards
Dario
Files:
range_bar.gif
13 kb
Rosh:
Very useful, thank you, but gumgum is right, it would be better if the examples tab was included in the classification, as they are simple and do not usually carry any meaningful load for traders looking for something new
Therefore, we fill Codebase with examples for different aspects of the MQL5 language.
You are missing trading opportunities:
- Free trading apps
- Over 8,000 signals for copying
- Economic news for exploring financial markets
Registration
Log in
You agree to website policy and terms of use
If you do not have an account, please register
DRAW_BARS:
The indicator plots the bars of the specified symbol in the separate window. The DRAW_BARS drawing style is used to plot the bars using the values of 4 indicator buffers with Open, High, Low and Close prices. The bars color and width changed after N ticks. The N variable is defined as input parameter, it can be changed using the "Properties" window.
See also: The Drawing Styles in MQL5.
Author: MetaQuotes