- How can I reference a custom indicator from my ea code?
- EA template
- Any rookie question, so as not to clutter up the forum. Professionals, don't pass by. Nowhere without you - 6.
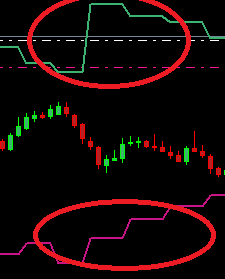
- MTF indicators display on the current chart what an indicator would show on a higher TF.
- Your EA doesn't need that. It can just read a standard indicator on the higher TF chart.

- 2019.09.24
- www.mql5.com
It looks like this book doesnt exist. All links i have found (the above included) take you to a 46-page teaser for the book. On the 46th page, there is a URL to buy the book, but the link is dead.
If you have a link to the actual complete book, please send.
- MTF indicators display on the current chart what an indicator would show on a higher TF.
- Your EA doesn't need that. It can just read a standard indicator on the higher TF chart.
Thanks @William Roeder
- Yes, I understand that an MTF indicator can show information from higher timeframes.
- Yes, my EA can read standard indicators easily from higher TF chart. This is easy to do in MQL.
My question is less about what MTFs are, or how to access their information. It is more around how to use that information.
For example:
If my EA is running on M1, and using Bollinger Bands to detect a trend, can it confirm the trend with, for example, an RSI running on H1? How do manual traders use this information? Why are people always looking for MTF indicators?
Thanks in advance.
kasinath:
It is more around how to use that information.
Why are people always looking for MTF indicators?- That is up to you.
So they don't have to add useless indicators to the chart, mostly ignore them, and then just before trading, change TFs, look at them, and change back. Clumsy and needlessly takes up chart real estate.
For example, in Rivalland's book he says do not trade when the weekly RSI(5) is above/below 82/18. I instead, wrote a reverse-RSI MTF indicator that shows what price has to be for the HTF RSI to be at those levels.

Do you mean something like this:
const int shift = 0;
const int x = iBarShift(NULL,PERIOD_M5,iTime(NULL,0,shift));
const double rsi_5m_0 = iRSI(NULL,PERIOD_M5,14,PRICE_CLOSE,x);
- That is up to you.
So they don't have to add useless indicators to the chart, mostly ignore them, and then just before trading, change TFs, look at them, and change back. Clumsy and needlessly takes up chart real estate.
For example, in Rivalland's book he says do not trade when the weekly RSI(5) is above/below 82/18. I instead, wrote a reverse-RSI MTF indicator that shows what price has to be for the HTF RSI to be at those levels.
Ah... got you. I will ignore these for now. I haven't needed them yet, and I guess i probably won't.
Thanks!
Do you mean something like this:
This gives wrong parameter count on iRSI. Any idea on how to work with higher timeframe in iCustom
- Free trading apps
- Over 8,000 signals for copying
- Economic news for exploring financial markets
You agree to website policy and terms of use