Indicators: OC Momentum
Good idea. Can you add arrow on chart and alert on slope change with arrow code and colour option.One bug is there when change n period it,s redraw histogram colour width to 1.
Thank you.
It is nothing special.
I will look at it.
Regards.
Jan.
This is beautifully simple. I'm trying to test it in an EA, but in the back test I see an error when I call it.
2020.05.02 07:57:20.264 2020.01.02 00:00:00 OC Momentum EURUSDi,H1: array out of range in 'OC Momentum.mq4' (72,34)
I traced it to this line
for (i=0;i<pos;i++)
Since pos=Bars-IndicatorCounted(), when you add "n" to pos, you walk past the end of the array/buffer.
Changing it to the following eliminates the runtime error when calling this in iCustom.
for (i=0;i<pos+n;i++)
One more thing... I'm not an expert in coding indicators... but it looks like you are not using previously_calculated, so the entire array is being filled each tick. Looking at the Alligator indicator which simply fills an array like this does I see you might want to change that line to this... it appears to work as desired for me...
//pos=Bars-IndicatorCounted();                  //this what you have

pos=rates_total-prev_calculated;                //this is what other indicators do
Incidentally, I edited this and recompiled and it *appears* to be working correctly in my terminal.
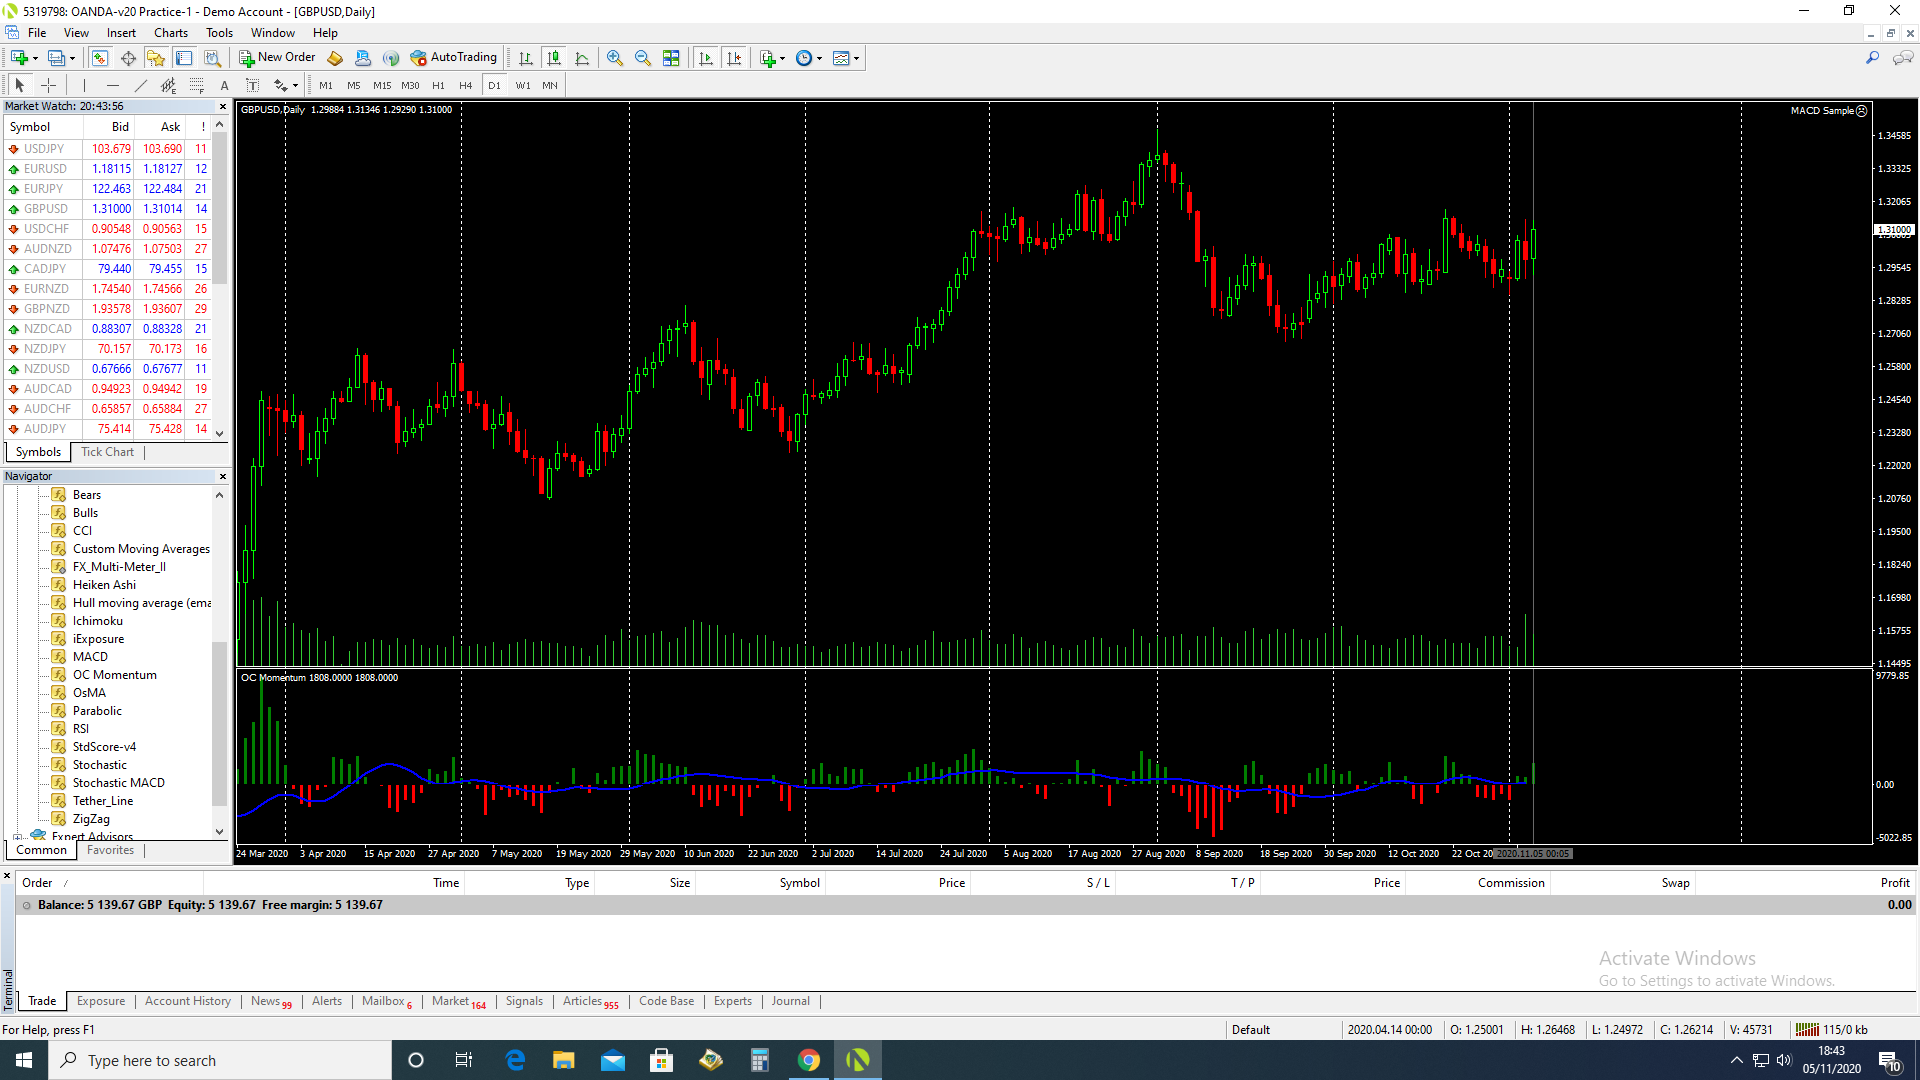
hello.. thank you for indicator.....is my 0{zero} line meant to look like this ??
Hello Abu Ridwaan,
you are right.
The indicator was developed for white background (I use) but the position of the zero line is still fairly clearly visible.
In the description is old picture of the original version of the indicator.
Your picture shows newer version with average line (blue).
The new version should simplify inrepretation.
If the average is above zero line you should think of long (buy) if the average is below zero line you should think about short (sell) position.
Once the average line crosses the zero line you only wait for the pullback to the direction of the trend.
You should use the indicator in clear trend enviroment.
Regards.
Jan.
- Free trading apps
- Over 8,000 signals for copying
- Economic news for exploring financial markets
You agree to website policy and terms of use
OC Momentum:
Simple oscillator with a histogram.
Author: JAN OPOCENSKY