Why ticks of RSI indicator have different timeframe length?
Hi, I noticed this with some other indicators too. They seem to have variable length between ticks. Lines drawn on the chart are of different
length with respect to timeframe. What is the reason behind it? How can I measure it?
- Multi Timeframe Indicators
- [WARNING CLOSED!] Any newbie question, so as not to clutter up the forum. Professionals, don't go by. Can't go anywhere without you.
- New Firebird EA
Your post is unintelligible. At least for me.
What could be the "timeframe length" of a tick !?
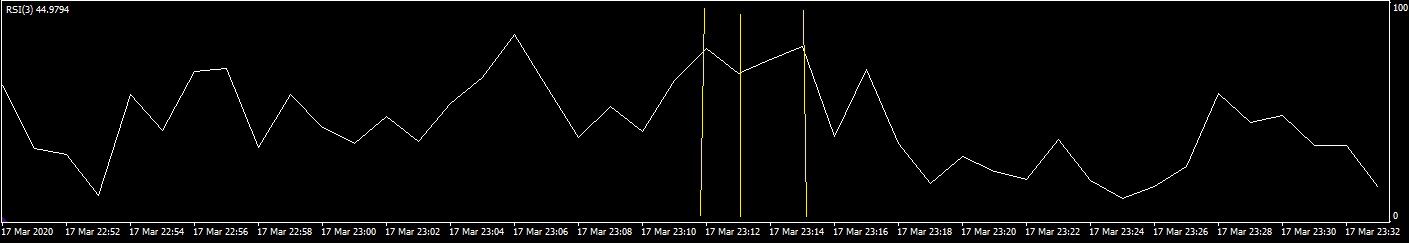
Lets say the price is Y axis and the time is X axis. The candles on chart are always equally spaced because their time-length is fixed (to 1minute
5minute 15 etc.) but it is not the case for some indicators like RSI. Visually lines look longer or shoerter, not always the same length which
suggests not equal amount of time elapsed. I know the information is delivered by the broker in Ticks received by Terminal and processed
inside OnTick() function in EA, but Indicators don't use OnTick(), instead their calculations are based on bars so I don't understand the
difference in length on X axis.
Mikołaj Gogola:
Lets say the price is Y axis and the time is X axis. The candles on chart are always equally spaced because their time-length is fixed (to 1minute 5minute 15 etc.) but it is not the case for some indicators like RSI. Visually lines look longer or shoerter, not always the same length which suggests not equal amount of time elapsed. I know the information is delivered by the broker in Ticks received by Terminal and processed inside OnTick() function in EA, but Indicators don't use OnTick(), instead their calculations are based on bars so I don't understand the difference in length on X axis.
Lets say the price is Y axis and the time is X axis. The candles on chart are always equally spaced because their time-length is fixed (to 1minute 5minute 15 etc.) but it is not the case for some indicators like RSI. Visually lines look longer or shoerter, not always the same length which suggests not equal amount of time elapsed. I know the information is delivered by the broker in Ticks received by Terminal and processed inside OnTick() function in EA, but Indicators don't use OnTick(), instead their calculations are based on bars so I don't understand the difference in length on X axis.
Nonsense ... think a bit of what you have written there. All that just means that rsi is more responsive to price changes. Nothing else.
Which part exactly is nonsense?
Mikołaj Gogola:
Which part exactly is nonsense?
Which part exactly is nonsense?
All of it. Leaving this thread. All the best
Its not nonsense and I really hope someone who understand what I mean will answer this.
The horizontal spacing between measurement points is not equal for indicators like RSI, why?
I can't put it simpler.
The horizontal spacing between measurement points is not equal for indicators like RSI, why?
I can't put it simpler.
You could add a screenshot with your observation.
Mikołaj Gogola:
here
It might be helpful if you would turn on CHART GRID.here
You'll notice what you might have missed.
You are missing trading opportunities:
- Free trading apps
- Over 8,000 signals for copying
- Economic news for exploring financial markets
Registration
Log in
You agree to website policy and terms of use
If you do not have an account, please register