Who can explain the creating progress of ZiZag standard highs/lows as in this picture?
Hi all,
I'm a newbie to forex,
Who can explain for me the progress of creating Highs/Lows on the standard ZiZag indicator on MetaTrader4?
How to the depth parameter used from very startup of ZigZag indicator on MetaTrader4 with default setting (12,5,3)?
I've attached here two pictures of that,
Picture 2 is my questions,
Please see and explain,
<<You can comment to the picture1 for explaining>>
Thank you.
Hi,
It is very interesting to use them BUT be carefull because it redraw up to it change the direction, you have to use it with another indicator MACD or stochatic, and exponentiel moving everage EMA, maybe bolinger band to be shure that all is right. draw 2 or 3 time frame in the same time frame. Use support and resitance that you can see in your chart with the zigzag . it is a good information how the price will move.
ex: for zigzag with 3 different color
M5 -> 12,5,3 and 3* M5 (M15) -> 36, 5, 3 and 6*M5(M30) -> 72, 5, 3 all in the M5 chart. you will be able to check the wave for each timeframe. a nice information to know the direction about price.
often check the M30 and the M60(H1) to know if the direction change. check the patern with higher time frame. if your new in the game use the demo mode, not your money to get a good understanding how that works. Keep in mind that about 80% of trader fall down in the way. patience before launch a trade.... good luck
Hope that will help a bit.
Laurent
Lookat the pic and check a way to use it. you can make your own -> bb ,ema .....
Hi Laurent,
Thank you for your useful informations!
You're an expert, sure!
At first, I want to understand what is behind of the way ZigZag draw it's lines on the chart,
I know the indicator based on 3 parameters (depth, deviation, backstep) to draw its graphic,
But can you explain step-by-step the way ZigZag use theses parameters to draw it's lines on the chart?
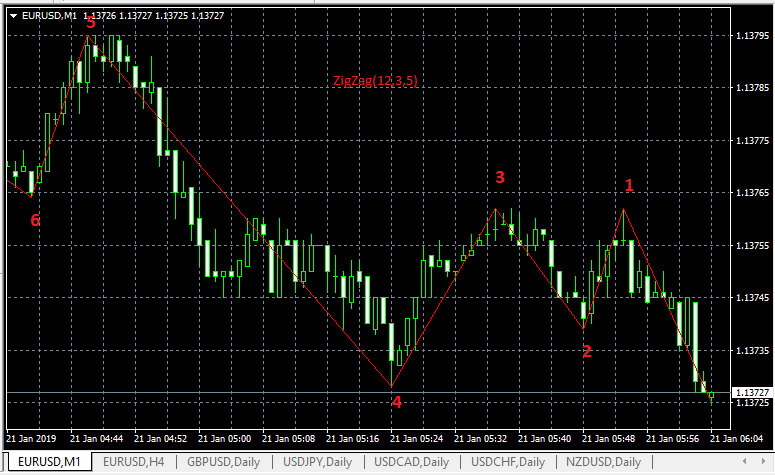
As image I've attached below, in 6 extremes I've marked in 1,2,3,4,5,6 that ZigZag drawed, which is created first?, how it does?, which is created second?, how it does?, which is created third?, how its does?, ... so on.
I dont know the way ZigZag select it's first extreme (High/Low) on the chart, and the progress after that.
Can you explain?
Thank you so much.
Hi Laurent,
Thank you for your useful informations!
You're an expert, sure!
At first, I want to understand what is behind of the way ZigZag draw it's lines on the chart,
I know the indicator based on 3 parameters (depth, deviation, backstep) to draw its graphic,
But can you explain step-by-step the way ZigZag use theses parameters to draw it's lines on the chart?
As image I've attached below, in 6 extremes I've marked in 1,2,3,4,5,6 that ZigZag drawed, which is created first?, how it does?, which is created second?, how it does?, which is created third?, how its does?, ... so on.
I dont know the way ZigZag select it's first extreme (High/Low) on the chart, and the progress after that.
Can you explain?
Thank you so much.
Highest high & lowest low on the last n bars ?
Hi Laurent,
Thank you for your useful informations!
You're an expert, sure!
At first, I want to understand what is behind of the way ZigZag draw it's lines on the chart,
I know the indicator based on 3 parameters (depth, deviation, backstep) to draw its graphic,
But can you explain step-by-step the way ZigZag use theses parameters to draw it's lines on the chart?
As image I've attached below, in 6 extremes I've marked in 1,2,3,4,5,6 that ZigZag drawed, which is created first?, how it does?, which is created second?, how it does?, which is created third?, how its does?, ... so on.
I dont know the way ZigZag select it's first extreme (High/Low) on the chart, and the progress after that.
Can you explain?
Thank you so much.
Hi,
It is an indicator that is very intersting but it need to be use with care , it can be your friend or the devil :))
use it with bolinger band , nice because together it can be a great information to know if the price will go up or go down
So I give you some link that will help you to use zigzag and understand how to set it for the best result. always check the highest time frame to enter in a trade , draw your resistance and support, dayly , weekly and monthly to get a good view where the price will (maybe) goes.
https://admiralmarkets.com/education/articles/forex-indicators/zigzag-indicator
https://www.mql5.com/en/forum/151011
https://www.investopedia.com/ask/answers/031115/how-do-i-use-zig-zag-indicator-create-forex-trading-strategy.asp
https://www.google.fr/search?q=how+to+use+zigzag+mt4&tbm=isch&tbo=u&source=univ&sa=X&ved=2ahUKEwie0ozfjP_fAhUONhoKHQ6fC6QQsAR6BAgAEAE
You need to feel the game with your indicator, make a plan for your trading, never go like " it seems good...., you will loose often, you will win and you will loose but loose must be less than win. put always your stop loss and do not move it , if your wrong it will safe your money. the forex not so easy . but with practice you will get profit slowly but for shure.
for demo account take the amount of money you will use, don't use 10000 euros if you will open a 500 dollars account. 1% or 5% maximum for your trade to be in the game for always, if you loose more than 2 times. stop all and check why you lost that trade. etc....
So some work on the table :)) and keep your mind fresh
laurent

- admiralmarkets.com
Hi Laurent,
Your recommendations are so good!
Thank you alot.
Hi Laurent,
Your recommendations are so good!
Thank you alot.
it is a nice if that could help you,
happy to ear you.
Try to search with google with zigzag mt4 strategy or something like that... :))
Laurent
The standard zigzag is created based on High & Low in period of bar times. You will see minor and major of High & Low in this process.
Hi Laurent and Zamzuri,
Can you mark sequence of extremes recorded by ZigZag step-by-step on the chart in image attached below? (first, second, third, ...)
And Why it does that in conditions of Depth = 12, Deviation =5 and Backstep = 3.
Because I dont understand the way ZigZag using the Depth parameter,
Thanks.
Hi,
Please don't use the M1 chart to use the zigzag, cause it will be the death for your trade..... start from M5 and higher, M1 is to get a LASER start like if you use a microscope but you can't decide to start from.
(from my experience :)))) but if you want you can find your way to use it.
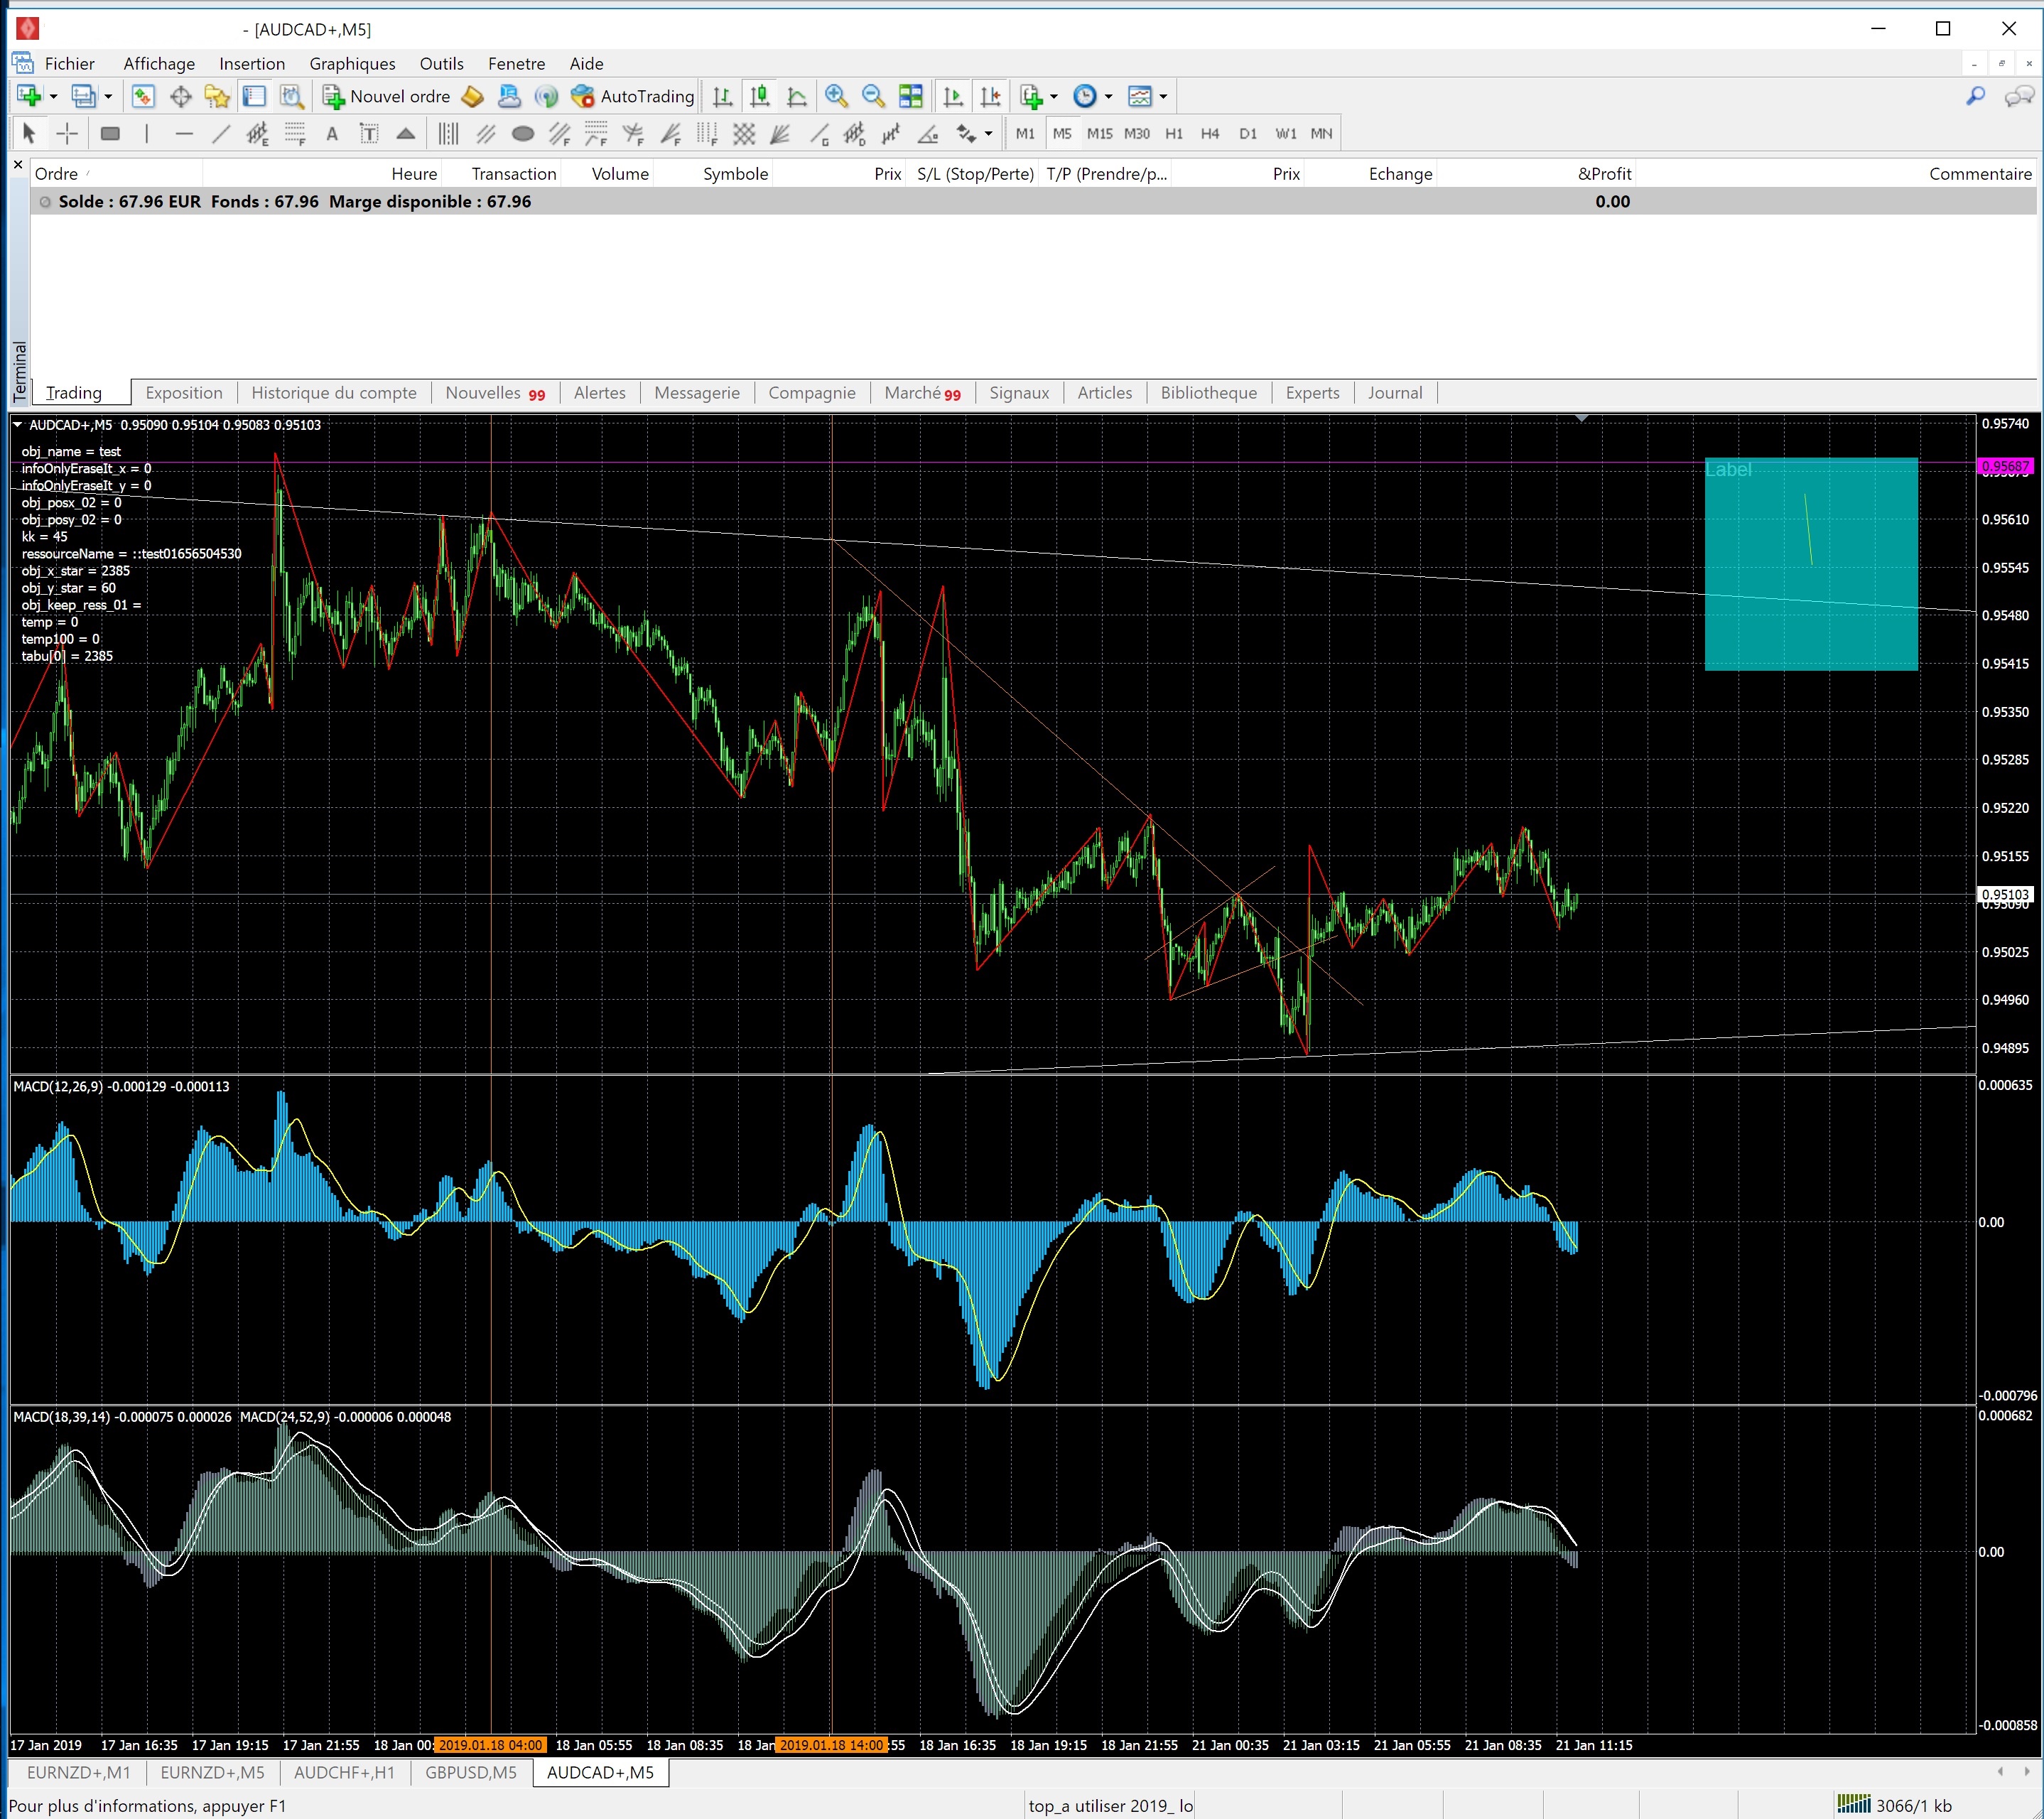
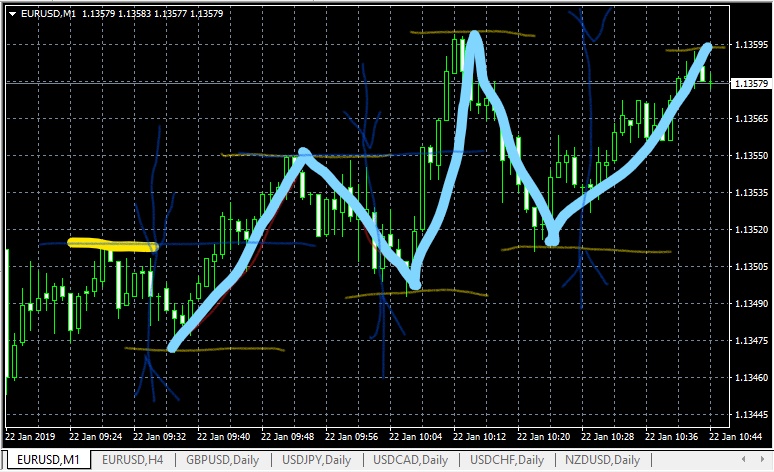
On your chart (pic you gave) you draw line support and resistance from them you can draw the zigzag from one point to another point.
look at the chart :)) (the move under the zigzag are lower time frame, but the trend is from a higher time frame.
you see zigzag and support resitance-> we are in a UPttrend with retracement between 30 and 50% High->Low
for the last 2 zigzag the Higher is about Higher than the previous so it is the time to check if the trend will go down. please use different time frame to check what the chart show you.
If you use a time frame like M1 or M5 use them with a small zoom (dezoom) you will see better pattern on your screen.
What else.... all indicator are usefull but don't tell you the price for the futur. take care about that. don't follow absolutly the indicator. check the "price action" resistance and support"
Ema and 3 or 4 time frame. use the alert for ema that tell you something is on the way for that pairs, etccc. because your mind can't follow all at the same time. take on or 2 trade a day but those should be enough sure to put the money in your wallet. don't over trading. quality is the best against quantity :))
So ask me if you need . i am not an expert but 2 mind is better than one :)))
laurent
use the zigzag like this don't change the set.
https://www.mql5.com/en/articles/1470 about zigzag
https://www.forexmt4indicators.com/fr/zigzag-nk-color-price-indicator-metatrader-5/
from a website:
ZigZag Indicator MT4 Settings
The ZigZag indicator tracks and connects extreme points of the chart, the distance between these points being equal to or higher than the percentage specified for the price scale.
To use the ZigZag indicator, a percentage of price movements must be set. Although the default value for a ZigZag deviation is 5, a setting of 10 would ensure that only price fluctuations of 10% or more would be shown in the chart. This eliminates smaller price swings and allows the analyst to see the bigger picture.
Normally, the closing prices of Forex pairs are used, and imaginary points are placed on the given chart where the price reverses by the set percentages. These points are then connected by straight lines, red by default, and the ZigZag appears.
The default settings are shown in the screenshot above... and here is how we should read them.
Depth is the first setting of the ZigZag indicator. This is the minimum number of bars with no second maximum or minimum deviation from the bar.
Deviation is the number of pips or points (depending on the market) after the previous minimum or maximum is formed.
Backstep is the last setting and reflects the minimum amount of bars between which the high and low can be plotted.
These settings should be adapted to various markets, and you will probably end up using different settings for one market or instrument versus another. Additionally, you could also end up changing the settings for the same market or indicator when the market conditions change along with its volatility.

- www.mql5.com
Hi Laurent,
Your most value advice: not to overtrade!
Thank you warmly.
- Free trading apps
- Over 8,000 signals for copying
- Economic news for exploring financial markets
You agree to website policy and terms of use
Hi all,
I'm a newbie to forex,
Who can explain for me the progress of creating Highs/Lows on the standard ZiZag indicator on MetaTrader4?
How to the depth parameter used from very startup of ZigZag indicator on MetaTrader4 with default setting (12,5,3)?
I've attached here two pictures of that,
Picture 2 is my questions,
Please see and explain,
<<You can comment to the picture1 for explaining>>
Thank you.