Discussion of article "Movement continuation model - searching on the chart and execution statistics"
The Expert Advisor does not work for me. I trade futures on the Moscow Exchange and there the number of decimal places in the futures price is "0", but you do not take this into account and lots are not less than 1 when trading.
Good day, the Expert Advisor is designed to work with currency pairs
Great !Thanks for the interesting and useful material. The idea and its realisation are worthy of attention. With respect to the author's labour.
Thank you for taking your time for this work!
High praise, great article.
Too bad MetaQuotes can not be rated.
Very detailed and well commented!
The quality increases ....
Disliked. The author didn't say anything about the flaws in his system, you end up seeing a lot of those flaws. Sometimes it seems that if you write a lot and complicated, it is a good work. However, "a lot" and "complicated" are false indicators of good work.
It's a lot of water. Here's an example:
"and we also need to introduce a variable f, which will store the price digitisation depending on the number of decimal places in the instrument price."
It should be clear that the digits should be taken into account, why write about it separately and so long?!
Or here is more water:
"have string data type and to use them in calculations, they will need to be converted to double type using StringToDouble() function".
I don't understand, why create 2 CSV-files?! To see what was the maximum profit?! Open in Excel, delete the column.... Really?! You can't create a second CSV file without deleting it?
I like the idea of a major wave and a corrective wave. And instead of water, you should have considered the price behaviour and the work of the strategy in case of false signals.
Good afternoon. We are not talking about any trading system. The article discusses only one of the possible ways of determining the continuation pattern.
Regarding the obviousness of some points (in particular, about the f variable) and the fact that the article contains a lot of water:
for you it may seem unnecessary and unnecessary because you have a sufficient level of knowledge and skills. And for someone else, it might be useful. For me personally, two years ago it was a real challenge to programmatically define a round level.
About CSV - I'm sure you could implement this idea more elegantly. I haven't worked with CSV before, and writing an article is a good motivator to learn a new topic for me. Sorry if I did not please you.
About the strategy working with false signals: there is no strategy in this article, I wrote about it at the beginning of this comment. And the name of the article would have been different then, most likely. If you are interested, you can try to create a trading strategy based on this model and see how effective such a system will be.
This article discusses only one of the possible ways of determining a continuation pattern.
Almat, greetings!
counter question :
why is the method itself a complicated "tambourine dance" to find the "continuation" trend (?!), if at the very beginning of the topic you have already drawn everything (!).
here is your screen with the model :
... just screw in a regular ZZ, and find the Extremes that correspond to Letters A-B-C-D (!), and just = rewrite the whole article :))))).
... besides - your Model --> reminds very much of the strategy : "Trade on the breakdown of the previous ZZ extremum" (!) :))
for example: when Ray-'C-D' breaks the top of 'B' ==>>> open a position in the direction of the breakdown (!)
... if you want to explore this topic in more detail, and write a test Owl, I invite you in private !
let's agree on the features - from me - fresh ideas, and from you - coding of the EA ! :)
... besides - I have on this principle --> almost ready TOR with a full set of "features" ... I need a programmer to write the EA ...
- Free trading apps
- Over 8,000 signals for copying
- Economic news for exploring financial markets
You agree to website policy and terms of use
New article Movement continuation model - searching on the chart and execution statistics has been published:
This article provides programmatic definition of one of the movement continuation models. The main idea is defining two waves — the main and the correction one. For extreme points, I apply fractals as well as "potential" fractals - extreme points that have not yet formed as fractals.
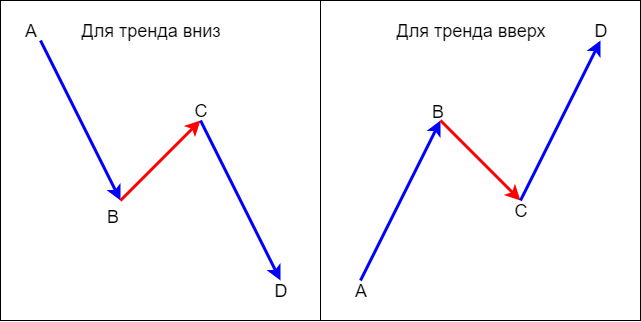
Movement continuation model described in the article consists of two waves: the main and the correction one. The model is schematically described in Figure 1. AB is the main wave, BC is the correction wave, while CD is the continuation of the movement towards the main trend.
Fig. 1. Movement continuation model
On the chart, this looks as follows:
Fig. 2. Movement continuation model on AUDJPY H4
In this article, we have analyzed the method of programmatically determining one of the movement continuation models. The key idea of the method is a search for a correction movement high/low extremum without applying any indicators. The consecutive points of the model are then detected based on the found extremum.
We also discussed the method of collecting statistical data based on the results of testing in the strategy tester by writing the test results into an array and their subsequent processing. I believe, it is possible to develop a more efficient way of collecting and processing statistical data. However, this method seems most simple and comprehensive to me.
Keep in mind that the article describes the minimum requirements for defining the model, and most importantly, the most minimal set of controls provided by the EA. For real trading, the set of controls should be expanded.
Author: Almat Kaldybay