Have you seen this before? What does that mean ?
Don't you know a BUY is at ask price and a SELL at bid price ?
Yeah I do. But shouldn't the ask be part of the candle high ?
This candle is the first one after a gap - don't know if you can see it. I suspect a quote/requote issue as I didn't notice the same gap on a metaquotes account chart.
Yeah I do. But shouldn't the ask be part of the candle high ?
This candle is the first one after a gap - don't know if you can see it. I suspect a quote/requote issue as I didn't notice the same gap on a metaquotes account chart.
Metaquotes is not a broker, forget it.
Anyway, I don't see a problem.
Icham Aidibe: But shouldn't the ask be part of the candle high ?
|
|
|
It's the 2 with the same color. You can see it in the zoomed one.
It is written that there's one tick here. Since that's where the deal occured, right ? So I draw a tool, I found no use for 'til now : real ticks, the exact ticks copy.
1. The exact price of the exit is 0.87773, the candle high is 0.87752, low 0.87709, hour : 10h30
2. So I open the Symbols - Tick new tab, and I track the rebels, it's about few ticks, which aren't the first, nor the last, which don't enter into the candle's constitution - they're higher the candle highest, but they are definitively present.
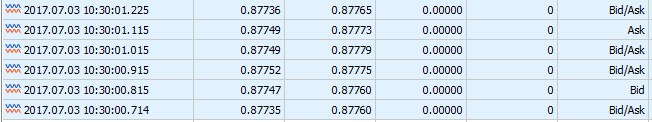
It's like noise. It's not normal, but it's real since the screenshot I show is from a live account.
I let you extrapolate on your side this to the "based on real tick mode".
[following offline]
Okay. Now, the high and the low value I gave are the one the brokers retains itself as being the minute high and the minute low as you can see on the following screenshot :
![]()
Broker side : the ticks I talked previously are emitted by the broker, but outta this range - so let's call it noise, real noise. There's noise around the high, as there's probably noise around others ticks during the minute. Think Roma, each broker with its own pizza recipe.
Platform side : The ontick() process absolutely each tick when received
Tester : minute-bar data, no noise.
I'm not unhappy to finally see clearly here around !
I am not sure what your conclusion is ?
1. The exact price of the exit is 0.87773, the candle high is 0.87752, low 0.87709, hour : 10h30
0.87773 is ASK price.
0.87752 and 0.87709 are BID prices.
All is normal.
It's matching with MACDSample. Maybe working on a tick scale, changes the whole thing ?
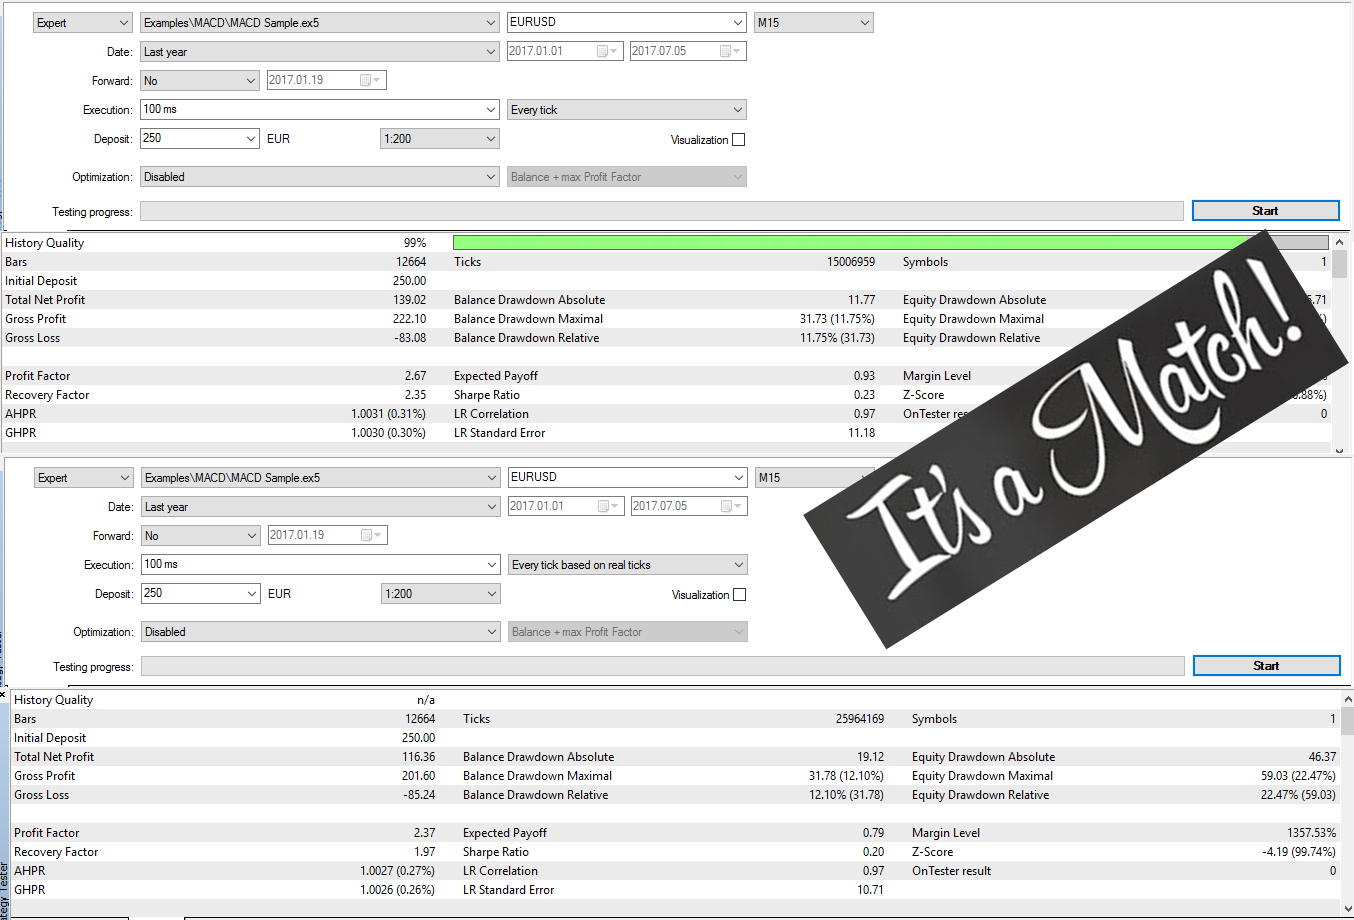
Example/Moving Average doesn't match as good as the MACDSample. MACD is made of moving average ! Where the difference from !?
There is inevitably a concrete explanation for this thing!

Icham Aidibe:
So minutes bar data are determined only by bid prices ? EDIT : checked, indeed only Bid prices to draw the candle | You buy at the Ask and sell at the Bid. So your sell order's TP/SL, and pending buy orders
will be triggered when the Ask reaches it. To trigger at a specific Bid price, add the average spread. The charts show Bid prices only. Turn on the Ask line to see how big the spread is (Tools -> Options {control-O} -> charts -> Show ask line.) |
- Free trading apps
- Over 8,000 signals for copying
- Economic news for exploring financial markets
You agree to website policy and terms of use
Even when zooming ... the red arrow is the re-entry but why is the blue one shifted ?