Value of Moving average Not Matching the actual average !!
Hi all,
I have come across a strange thing,
I've opened the GBPUSD daily chart, applied a 200 simple moving average on close values, the value of the 200 SMA was 1.5487
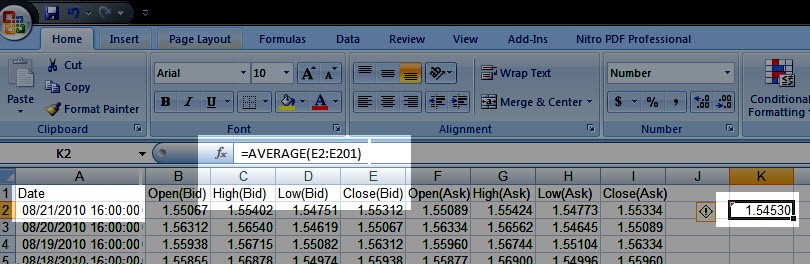
then I have downloaded the values (File,Save as) and calculated the average of the last 200 candles, and it was 1.5121 different from the indicator reading !!
any explanation ?
Are you sure you are using the close and the right formula because I'm getting correct numbers. Please post a screen-shot of your spreadsheet.
 -
-To further confirm my findings,
i've looked at a different platform (real account)
and the moving average is indeed different. Please compare the last candles (for example)
4 digits average and a 5 digits average will not be that apart.
I did some investigation and I'm getting the same SMA as the Indicator in MT4. Attached is my script and my output file. Make sure you're using SMA instead of SMMA.
int start(){
//#################################################################
//#################################################################
int File1=FileOpen("Close200.csv",FILE_WRITE,',');
for(int a=1;a<=200;a++){
   FileWrite(File1,Close[a]);
}
//#################################################################
//#################################################################
double Simple_MA=iMA(NULL,0,200,0,MODE_SMA,PRICE_CLOSE,1);
FileWrite(File1,Simple_MA);Alert(Simple_MA);
FileClose(File1);
//#################################################################
//#################################################################
return(0);}
- Free trading apps
- Over 8,000 signals for copying
- Economic news for exploring financial markets
You agree to website policy and terms of use
Hi all,
I have come across a strange thing,
I've opened the GBPUSD daily chart, applied a 200 simple moving average on close values, the value of the 200 SMA was 1.5487
then I have downloaded the values (File,Save as) and calculated the average of the last 200 candles, and it was 1.5121 different from the indicator reading !!
any explanation ?