Pattern Rocognition Indicator (s)
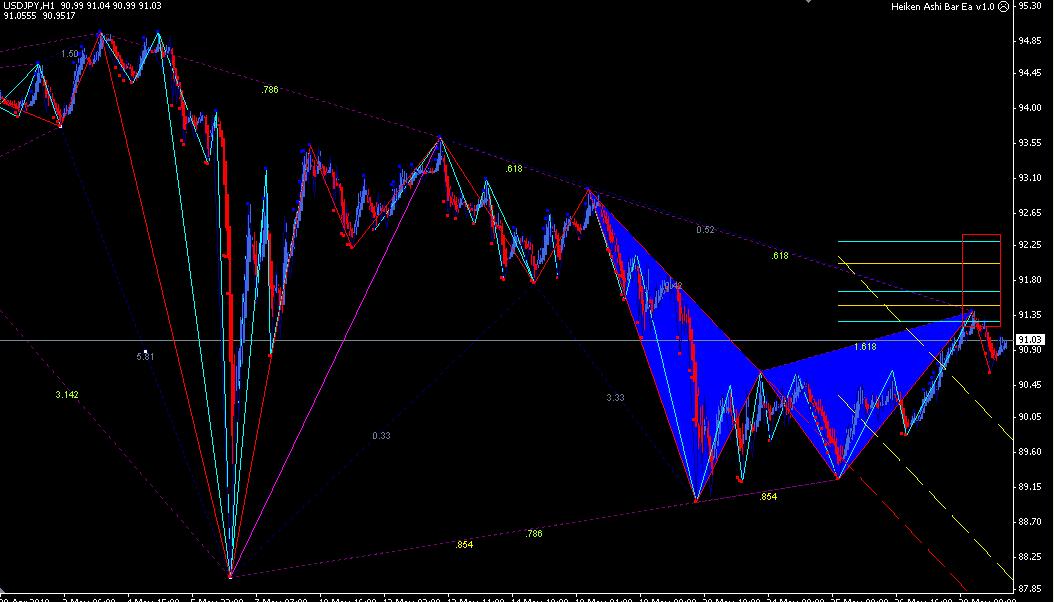
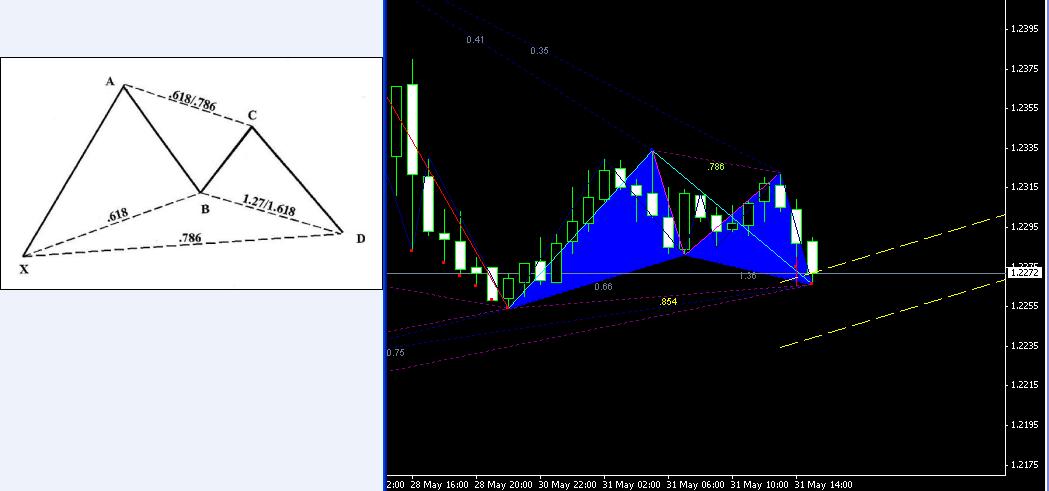
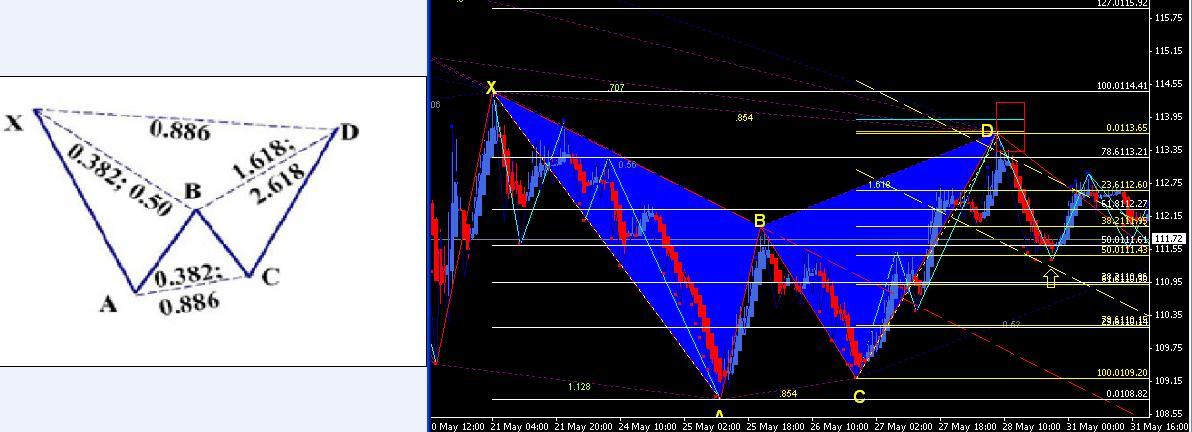
Attached is a Bullish Gartley identified by the ZUP indicator. I've also added the perfect Gartley pattern, per Carney.
As we can see, there were a couple of distances that did not conform to Carney's specifications.
- The retracement of D, from X to A was not 78.6%.
- The retracement of B, from X to A was not 61.8%.The other 2 distances were good.
- Retracement of B, from X-A was 38.2%However, retracement of D, from X-A was close but not exact to the 61.8%. I believe that most pattern enthusiast would count this.
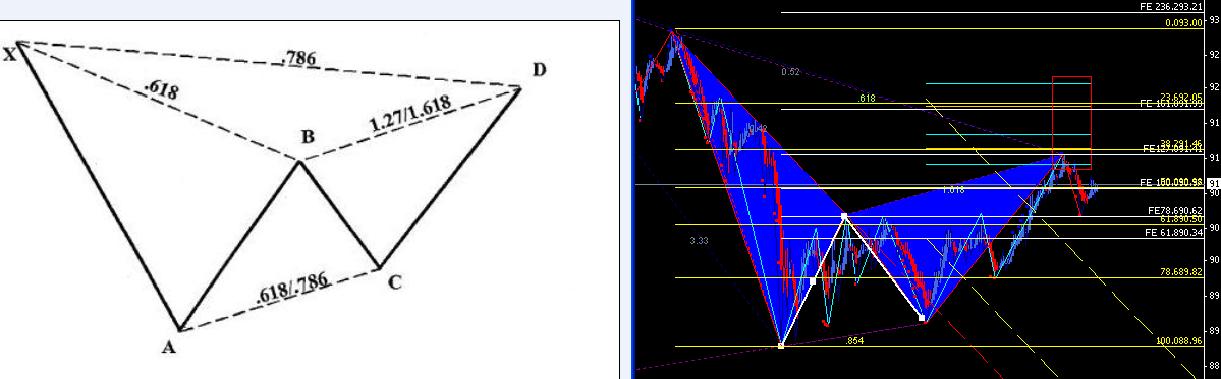
The attached chart has 2 sets of fibs that I plotted to ascertain retracement and extension levels.
The yellow fibs validated that B was indeed a 61.8% retracement of X-A.
The white is extension of A-B. It came in at 1.27, which meets Carney's criteria of an ideal bearish Gatley of 1.27/1.618.
D was 61.8 as shown on the ZUP. Carney's ideal is 76.8% and he considers this to be vital.
C was .854 as shown. Carney's ideal is .618/.786. This is the weakest.
The 2nd chart expands our view to include measurement points related to a previous high/low pivot points. Clearly these are fib ratios. What importance they hold to possibly validate this pattern is the question.
Since D was established this pair moved down 70 pips. We are back live now and can monitor movement.
If we draw a trend line from A to C, that would plot out support for exit, if this pattern was traded.
------
Edit: Note that the ZUP will repaint. This could mean that eventually Point D is validated to Carney's 78.6 requirement. As mentioned, D is currently at 61.8.
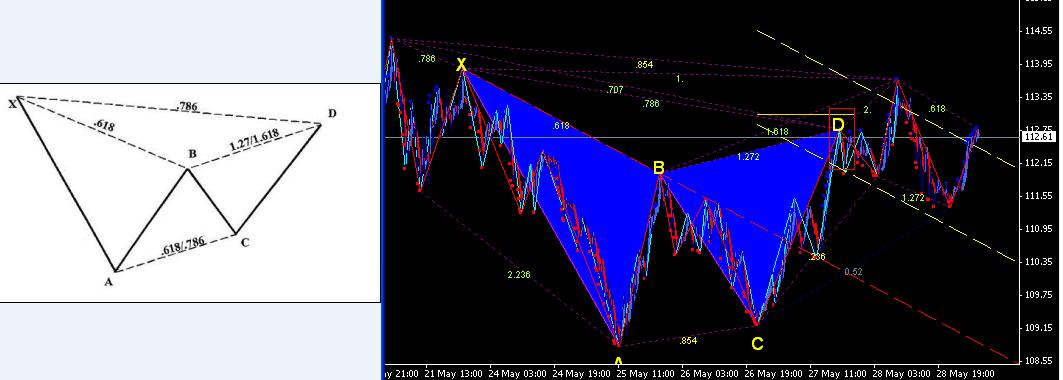
The attached chart is a 4-Hour.
All distances conform to Carney's ideal Bullish Gartley.
I plotted a retracement fib set (yellow) to confirm the 78.6 retracement of X-A. The closing price of the candles were on the 78.6 as a low. ***
B was close to the required 61.8% retrace of X-A.
This pair proceeded to move up from Point D on May 28th.
I plotted the blue trend line to act as resistance for exit, as well as entry for a sell. Let's see if the pair hits that trend line.
*** Edit: Carney believes that the 78.6% retrace (D) of X-A as the most important aspect of the Bullish Gartley.
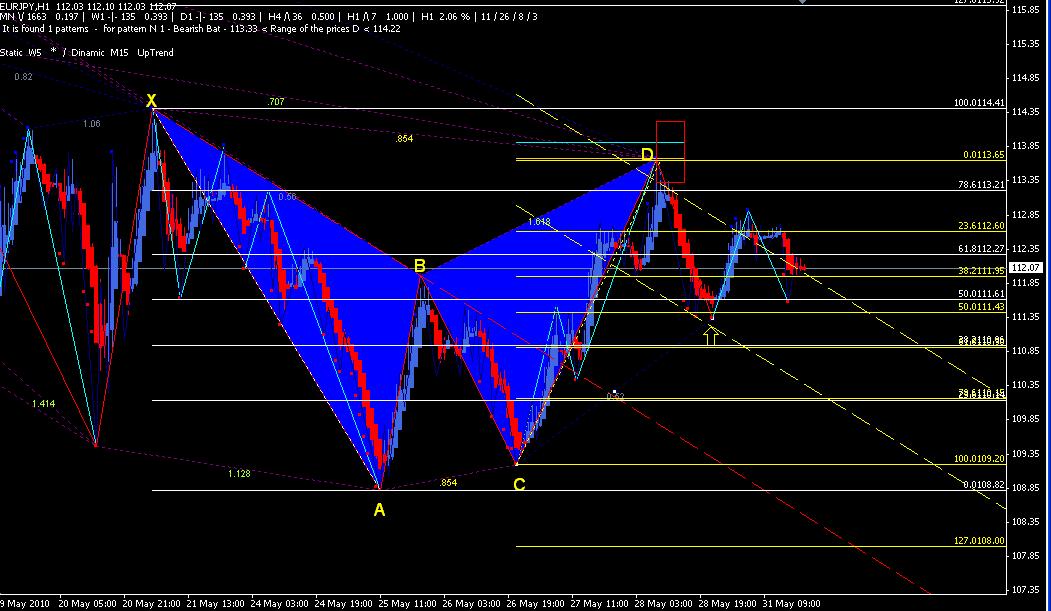
Here's another produced by the ZUP for EUR/JPY. Everything was perfect with one small exception.
The C retracement of A-B was slightly more than the Carney ideal. I'm seeing a lot of the .854, so it could very well be an acceptable ratio.
We can see on May 2th, the pair drop about 84 pips from the Point D.
I'm not sure if the built-in trade channels were painted at the time D was established. I'll have to monitor that. The short did hit the middle line of that channel and bounced.
These pics show how the market moves in relations to fibs, as every pivot is marked with one.
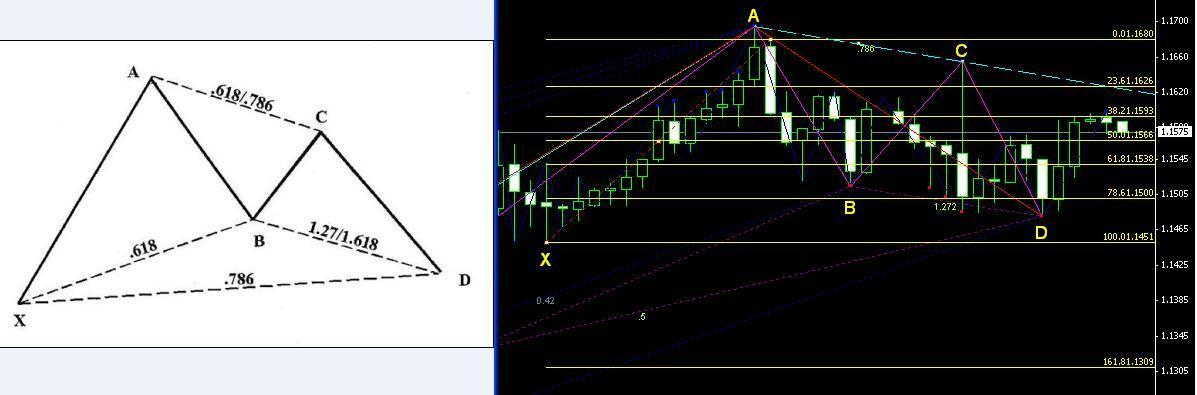
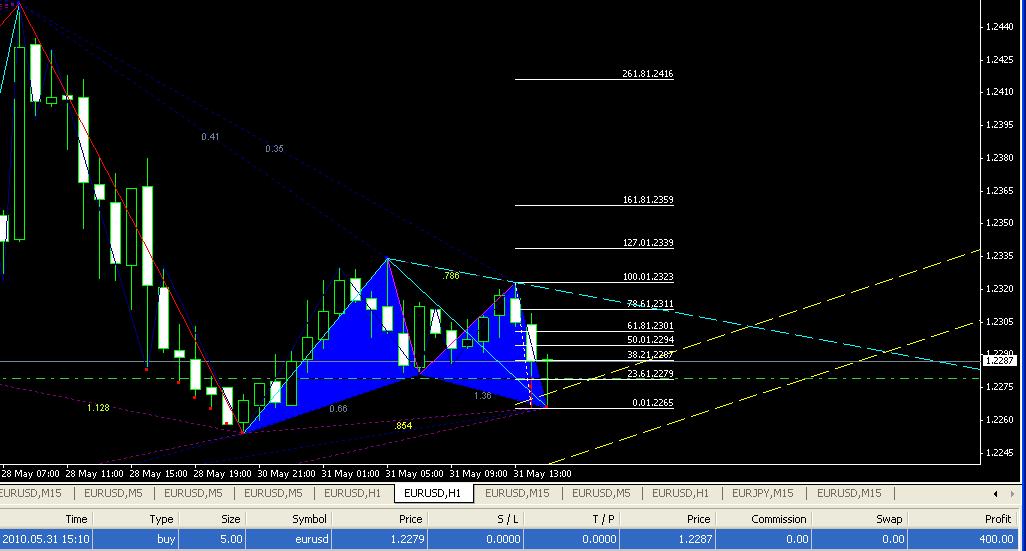
Driven by the surprise resignation of the German President, EUR/USD was sent down but experiencing a bounce. Happens that a Bullish Gartley developed, per attached 1-hour chart.
Draw retracement fibs from C-D for exit options on demo trade.
Edit: 2nd chart shows pair has retraced to the 38.2% fib.
Low was 1.2266
Entry (kind of late) was 1.2275
Pic at 38.2% retrace fib 1.2287,
Exited and filled at 1.2287 (as it went slightly above fib)
Profit = Plus 8 pips after spread.
Obviously, +8 pips nothing to get exited about, especially trading off the 1-hour. But due to this pattern not being a perfect Gartley, there could be a new low for Point D coming.
The distance of D** is 1.36 versus the ideal of 1.27/1.681. Therefore D can go further down to 1.681.
** to measure D, we pull fib retracement from B to C. We must make sure to check the default fib levels in our retracement fib tool. If 1.27 and 1.681 isn't there, we must add it.
Edit2: Having just said that D can go further down, I must recant. Since D's relationship to X-A is retracement, and
the current pattern has it at .854, and
the ideal is .786
it would invalidate the pattern if it went further down since the .854 would worsen and probably become a 100% retrace.
Sorry, working with the Gartley is rather new to me, but I'm a fast learner and I hope to get a better grasp on it soon. I had paid attention to the potential and historical value of the Gartley, but it was too complicated for me at the time. Now with the cutting edge indicator, it's much easier.
O.K., This pattern did indeed produce, and had just hit the 78.6% retracement of C-D.
Our original entry of 1.2275 would have resulted in a net profit of about 36 pips thus far.
Here's another produced by the ZUP for EUR/JPY. Everything was perfect with one small exception.The C retracement of A-B was slightly more than the Carney ideal. I'm seeing a lot of the .854, so it could very well be an acceptable ratio.We can see on May 2th, the pair drop about 84 pips from the Point D.I'm not sure if the built-in trade channels were painted at the time D was established. I'll have to monitor that. The short did hit the middle line of that channel and bounced.These pics show how the market moves in relations to fibs, as every pivot is marked with one.
-----
CORRECTION. This chart pattern is on the 1-hour.
I just want to follow up on that pattern. The first chart posted had Point D at the 61.8 retrace level of X-A, which conforms. However, if we look closely, it measured the new high at .854 but had not yet repainted the "wing" for that new Point D.
It has since done so, per attached chart. While we can see the fib ratio for D is now .854, we can determine that the candles closed at the 78.6 (white fibs).
I also plotted in yellow, the retracement fibs from C-D. These would be the take profit levels for me. The retracement hit the 50% fib (yellow arrow). This area also had a trend line produced by the ZUP indicator.
The ZUP utilizes virtually all of the fib tools, including fib arcs, and channels, fans. It also plots the Andrews Pitchfork, which are the 3 trade lines going downward in yellow and red.
234 gross pips profit from SELL at Point D to 50% retracement fib.
This pattern taught us the following:
D can repaint.
If we placed our stop-loss just above the 78.6 fib and entered at the original D of 61.8, there was an over-shoot which probably would have caused us to stop-out (based on stop-loss just above .786 fib).
If we waited and entered on the new Point D, safest stop-loss would have been just above X. That is the stop-loss rule from guru Carney.
If we know that .854 is a standard number, which I have just confirmed from the programmer's manual (posted on the indicator section under ZUP 84), then we can try to cheat to gain more leverage (to trade more lots based of risk scaling). If entry at the 78.6, stop-loss would be just above .854.
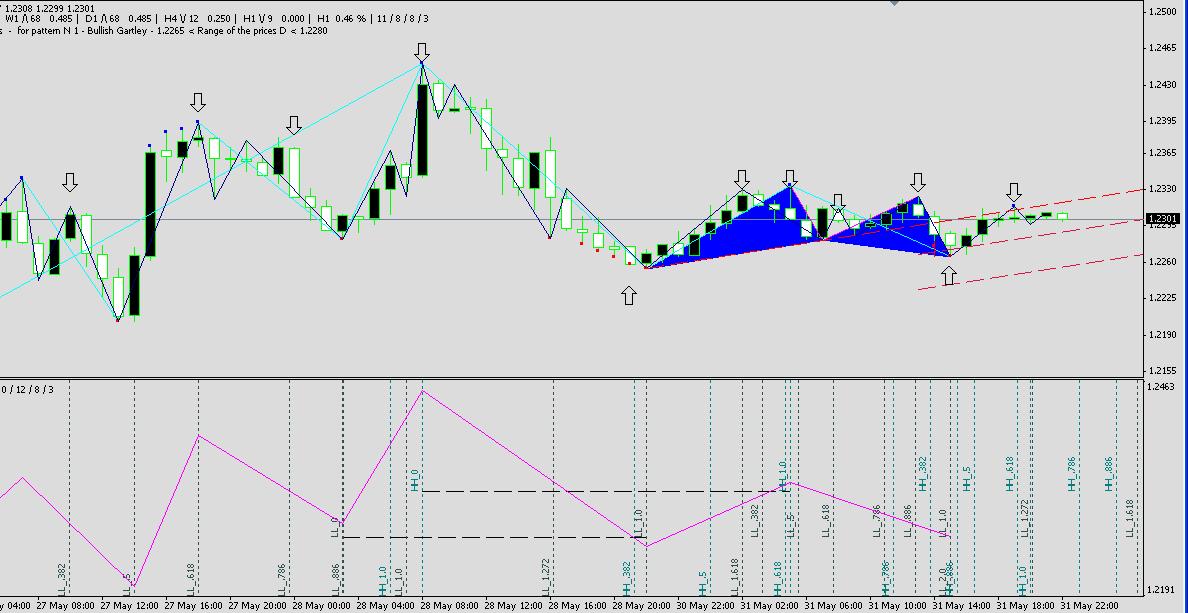
Attached is the 1-Hour EUR/USD chart with the aforementioned Bullish Gartley
I've added the indicator QTA_v4, which displays on the bottom. This indicator plots Fibonacci ratios moving left to right and into the future.
Some know this as the fib time zone (on MT4 platform, click "Insert", "Fibonacci, "Time Zones"). However, when I tried to plot this using the fib time zone, from the same start point, it did not duplicate the fib points as shown by the QTA_v4.
I inserted arrows at the candles denoting the major fib ratios, which coincides with turning points of this pair on the 1-Hour chart.
Although not every major fib hit a turning point, this tool was much more consistent than the fib time zone.
The furthest arrow to the right of this chart, pointing down, was the location of the top of the trend line (I assume its' Andrews Pitch Fork or fib channel). This also was the 78.6% retracement fib as noted on my previous post. In other words, an additional tool for exit for this scenario.
Attached is the indicator QTA_v4. I'll have to research what exactly the 2 designations HH and LL mean. Higher high, lower low perhaps, but how to interpret?
The QTA_v4 was used by "the contributor" as mentioned in my first post of this thread, to pair up with the ZUP.
LOL...got my threads mixed up and posted ZUP info/action on the ABCD thread. Go to end of that thread please.
The last post regarding the EUR/JPY pattern. It was actually a Bearish Bat, not a Bearish Gartley. attached is the pic with distances for ideal pattern.
Note that the ZUP developer recognizes .854 as a standard number, while pattern gurus Pesaveno and Carney use .886. Thus, depends on various authors and gurus.
- Free trading apps
- Over 8,000 signals for copying
- Economic news for exploring financial markets
You agree to website policy and terms of use
In the Indicators thread is the ZUP indicator. This thread is for analysis of pattern recognition with emphasis on the ZUP indicator.
Again, I am a novice at this but encourage input, questions, and examples from all. Let me start with a little background.
H.M. Gartley was credited with discovering the pattern named after himself, "The Gartley". However, he did not assign Fibonacci ratios to the distances between points. He published a book in 1935, which cost about $1,000, a very handsome price at the time. I guess he knew he was on to something that worked and charged for it.
Scott Carney published the book "The Harmonic Trader" in 1999 that refined the Gartley pattern and assigned specific Fibonacci ratios. There had been and has been various versions that differ in fib ratios. Mr. Carney has since published Volume 2 of his book. His web site is very informative and I encourage you to visit:
Welcome to HarmonicTrader.com
You can find a used copy of The Harmonic Trader (Vol 1) on amazon.com for as low as $29.
Carney also has developed a scanner, but the live version requires an E-Signal feed.
Although these patterns work in all markets, most of the tools in the past has been geared for the stock market. It's easy to understand that there are hundreds of stocks that can be scanned. In Forex, all we can do is scan the different pairs and time frames.
I have gleaned most of my knowledge on the ZUP indicator from another site, where a contributor posted updates and analysis. It appeared to me that the contributor has a close relationship with the person that programmed the ZUP. The programmer's name is nen and he has his own page on a Russian web site: "http://www.onix-trade.net/forum/index.php?showforum=54"
From what I have digested, most of the analysis pertains to using the ZUP on the daily charts. However, since some of us are intra-day traders, I'd like to review patterns on shorter time frames a well.
Please note that we must load all of the indicators that accompany the ZUP.