Why on every tick would you do that?
//--- set arrays as series, most recent entry at index [0]
   ArraySetAsSeries(ExtMacdBuffer,true);
   ArraySetAsSeries(ExtSignalBuffer,true);
   ArraySetAsSeries(ExtHistogramBuffer,true);
   ArraySetAsSeries(ExtHistogramColorBuffer,true);
   ArraySetAsSeries(ExtFastMaBuffer,true);
   ArraySetAsSeries(ExtSlowMaBuffer,true);
Hi
I keep on getting the following error
"can't open "C:\Program Files\MetaTrader 5\MQL5\Indicators\Examples\MACD_Histogram_MC.ex5" output expert file (2) 0 0
EX5 write error 1 1 "
I'm assuming I'm the only one who is getting this error as no1 else has commented on this.
Please let me know how I can fix it.
Thank You
I guess you copied the MACD_Histogram_MC.mq5 file in "C:\Program Files\MetaTrader 5\MQL5\Indicators\Examples\". It's not a good directory.
Your problem is an UAC issue, you can resolve it by following this procedure:
Expert Advisors: Renko Line Break vs RSI EA
angevoyageur, 2013.08.19 11:12
- In your MT5 platform click on Metaquotes Language Editor button (or press F4)
- In MetaEditor, you have the Navigator window, right-click on Indicators
- In the popup window click on Open Folder, a new window open.
- Copy the indicator source code in this window.
- Once copied, double-click on the file, it opens in MetaEditor, then click on Compile button (or F7).
You can now run the EA.
Hi,
Brilliant works perfectly.
Thank You for your excellent assistance
Cheers
Hi,
Brilliant works perfectly.
Thank You for your excellent assistance
Cheers
Interesting variant. The lines coincide with the histogram on the standard MACD.
And the histogram shows the crossing of lines.
The standard MACD is a cut-down version?
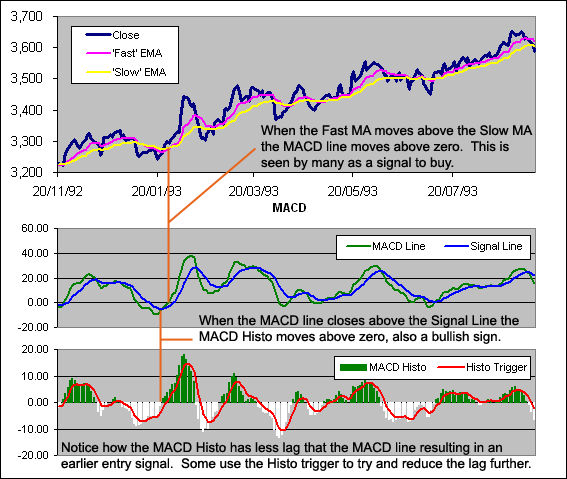
MACD stands for Moving Average Convergence Divergence and was first developed by Gerald Appel in the late 1970s. It is an Absolute Price Oscillator (APO) and can be used in an attempt to identify changes in market direction, strength and momentum.
It calculates the convergence and divergence between a ‘fast’ and a ‘slow’ Exponential Moving Average (EMA) known as the MACD Line. A signal EMA is then plotted over the MACD Line to show buy/sell opportunities. Appel specified the MA lengths as the following percentages:
- Slow EMA = 7.5% (25.67 period EMA)
- Fast EMA = 15% (12.33 period EMA)
- Signal EMA = 20% (9 period EMA)
One of the biggest challenges when dealing with financial data is noise or erratic movements that cause false signals. By smoothing data out you can reduce the number of false signals. But this comes at a cost, and causes an increase in the lag of your signals. The genius of the MACD is that it begins by smoothing data (thus causing lag) and then speeds up the signals from the smoothed data. This combination helps to reduce false signals while minimising the lag.
By comparing EMAs of different lengths the MACD can help to identify subtle changes in the trend and momentum of a security. It is a great visual representation of the acceleration or rate of change in a trend.

How to Calculate a MACD
MACD Formula:
- MACD Line = EMA,12 – EMA,26
- Signal Line = EMA[MACD,9]
- MACD Histogram = MACD – Signal Line
- Histogram Trigger = EMA[MACD Histo,5]
MACD Excel File
We have put together an Excel Spreadsheet that will automatically adjust to the MACD settings you desire. Find it at the following link near the bottom of the page under Downloads – Technical Indicators: Moving Average Convergence Divergence (MACD)
Test Results
Is the MACD an effective indicator? We are putting it into the ring for the Technical Indicator Fight for Supremacy. It will be tested through 300 years of data across 16 global markets to discover which settings produce the best results and how it performs compared to other indicators:
- Moving Average Crossovers – Completed - Golden Cross – Which is the best?
- Moving Average Convergence Divergence (MACD) – Completed – Results
- ZeroLag MACD (ZL-MACD)
- MACD Z Score (MAC-Z)
Hi is there a version for MTL4 ? thanks.
Hello,
Thank you for the Traditional MACD and I like it very much. I have a problem though that I can't figure out. For some reasons, after a while, the MACD and the Signal lines separate from each other. Then I double click on the indicator; the MACD Histogram window pops up and I click OK. Then, everything goes back to normal; the lines cross as they supposed to. I had no problem installing the file. Actually, I just double clicked on it and it installed itself into Navigator/Indicators/Markets folder. I would appreciate your opinion about the problem. Thanks again.
- Free trading apps
- Over 8,000 signals for copying
- Economic news for exploring financial markets
You agree to website policy and terms of use
MACD Histogram, multi-color:
A MACD indicator with histogram to show the difference between the MACD and Signal lines.
For the calculation of the MACD line you can choose from the usual price types. For the calculation of the Signal line yo can choose between SMA or EMA. The histogram can be switched between single and multi-color.
Author: traderak20