Expert Advisors: Renko Line Break vs RSI EA
Renko Line Break vs RSI EA:Tried to upload to MT5. The icon in the upper right corner appears and disappears. EA is not installed.
I have not changed the settings.
What can be the reason?
Author: Serhii Ivanenko
Sorry, I can't figure it out, I added Renko Line Break to the \MQL5/Indicators\ folder, but I can't add it to the chart through the terminal, the terminal doesn't find it, what can be the reason?
Reload the terminal or compile the indicator. Everything seems to work for me:

The renkolinebreak indi is already in my folder however when I load the EA, it says : Creating renkolinebreak fails. and the EA was removed.
- In your MT5 platform click on Metaquotes Language Editor button (or press F4)
- In MetaEditor, you have the Navigator window, right-click on Indicators
- In the popup window click on Open Folder, a new window open.
- Copy the indicator source code in this window.
- Once copied, double-click on the file, it opens in MetaEditor, then click on Compile button (or F7).
You can now run the EA.
Forum on trading, automated trading systems and testing trading strategies
newdigital, 2013.10.16 08:04
How to Use Renko Bricks and Moving Averages to Find Trades
Talking Points
- Renko bars help filter the noise
- Renko bars reveal clearer entries and exits
- Moving Averages can be used with Renko bars with some minor setting changes to pinpoint entries
Seeing the trend without Forex market noise is the goal of every trader. Too many times, traders get head-faked by the twists and turns of price action.
In addition moving averages can be used to signal entries and exits as well. A couple of settings have to be changed in order to get the moving averages which are usually tied to time, to work with a chart system that is based on price.
To add a 13-period exponential moving average to the Renko chart, choose EMA from the Add Indicator menu then change “Number of periods” to 13.
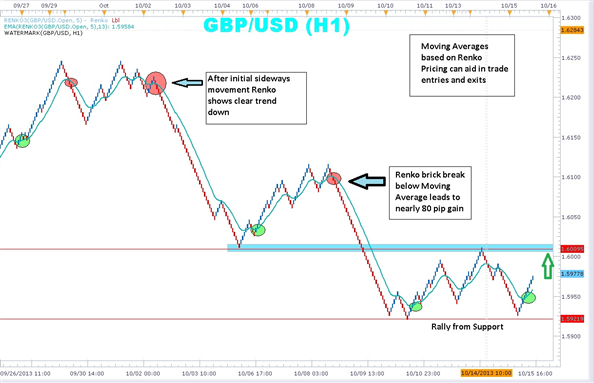
Notice the chart above which displays both Renko bars and a 13-period exponential moving average. A simple system can be built around the Renko bars and the moving average. When Renko price bars cross below the moving average and turns red, traders can enter short and stay with the trend until the Renko bars cross back above the moving average.
An initial stop could be placed just above the last blue Renko brick. Keep in mind that in the above example, each brick is equal to five pips. In the above example, the red circles mark where the Renko bars crossed below the moving average. A trader can see that a number of pips could have been gathered as the bars stayed below the moving average.
On the other hand, when the Renko bars change color and cross above the moving average, traders can enter long placing stop just below the last red Renko brick. The above chart shows in the green circles, points were the Renko price bars moved above the moving average generating a clear buy signal.
Renko charts, without the dimension of time, may take a little getting a little used to. But once you get the hang of them, you may find it difficult to go back to the candles. Adding a moving average gives excellent signals for entry and exit. Marrying them up with other indicators can magnify the benefits of trading without noise and scary wicks!
Forum on trading, automated trading systems and testing trading strategies
newdigital, 2013.10.12 11:16
Trading Trends with Renko Charts
Talking Points
- Renko harts filter out the noise of wicks and are based solely on price without time.
- Renko charts clearly indicate support and resistance.
- Can be used to confirm trends or can be traded on their own.
Have you ever been stopped out of trade only to have it move in the direction you originally thought?
Do you have trouble recognizing trend direction?
If you answered “Yes” to either one of these questions, then you may want to give Renko charts a try.
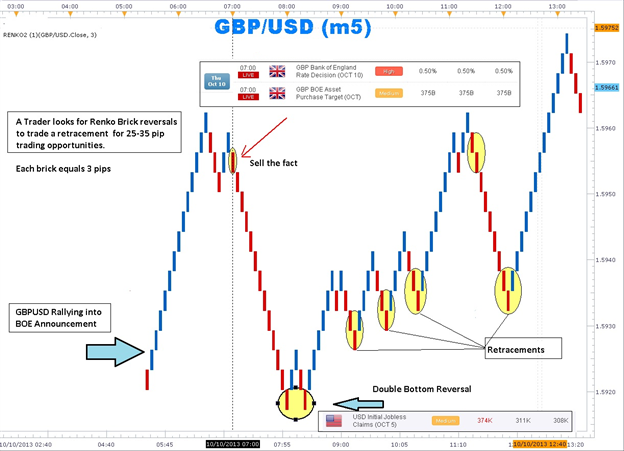
Renko means brick in Japanese. Every brick is the same size and a new brick is drawn one brick size below or above the brick before it. Bricks that are adjacent never overlap. Every brick starts where the previous brick ends. Traders can specify the size of bricks in pips. In the example above, the distance from the high and low of the brick is three pips. So a ten brick move is equal to 30 pips (10 bricks times 3-pip height brick).
Price can move above and below the previous brick until the minimum number of brick is met. This may be a surprise for most traders who are used to a new candle being formed at a specific time. We can see 13 bricks in a row heading up going into the Bank of England rate decision. Once the decision is released the bricks changed in color from blue to red and there was a lower high leading to a 13 brick decline.
A double bottom that happened when the US Initial Jobless Claims was released ended the selling and the uptrend resumed on the weaker US data. The negative sentiment for GBPUSD following the Bank of England interest rate announcement could be easily seen with streak of red bricks.
How to Trade Using Renko
A simple system could be used in which if we have 2 bricks of the same color establishes a trend that we could use as a trigger to either get long or short. On the other hand, a 1 brick of the opposite color ends the trend and we would exit the trade.
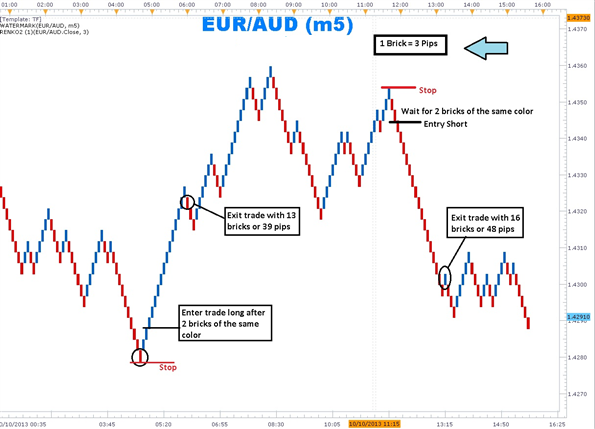
Buy filtering out time and whipsaws, Renko charts were able to map out market sentiment within small time frames like the 5-minute chart which usually have a lot of noise. However, Renko has its drawbacks. When a line of bricks goes into a range changing color after 2 or 3 bricks, traders can get whipsawed by price action.
It is easier to stand aside and wait for Renko bricks to move from the congestion channel and begin trending again. This can be clearly seen at the end of the EUR/AUD chart as the line of bricks breaks out to a new low clearing past the previous congestion area.
In sum, it is easy to see that Renko charts can provide forex traders with a new and fresh way to approach price action. Being based on price action rather than time, traders can stay with trends longer and exit with confidence with clear signals.
Forum on trading, automated trading systems and testing trading strategies
newdigital, 2013.09.03 11:03
Renko (extraction from Achelis - Technical Analysis from A to Z)
============
Overview
The Renko charting method is thought to have acquired its name from "renga" which is the Japanese word for bricks. Renko charts are similar to Three Line Break charts except that in a Renko chart, a line (or "brick" as they're called) is drawn in the direction of the prior move only if prices move by a minimum amount (i.e., the box size). The bricks are always equal in size. For example, in a 5-unit Renko chart, a 20-point rally is displayed as four, 5-unit tall Renko bricks.
Kagi charts were first brought to the United States by Steven Nison when he published the book, Beyond Candlesticks.
Interpretation
Basic trend reversals are signaled with the emergence of a new white or black brick. A new white brick indicates the beginning of a new up-trend. A new black brick indicates the beginning of a new down-trend. Since the Renko chart is a trend following technique, there are times when Renko charts produce whipsaws, giving signals near the end of short-lived trends. However, the expectation with a trend following technique is that it allows you to ride the major portion of significant trends.
Since a Renko chart isolates the underlying price trend by filtering out the minor price changes, Renko charts can also be very helpful when determining support and resistance levels.
Calculation
Renko charts are always based on closing prices. You specify a "box size" which determines the minimum price change to display.
To draw Renko bricks, today's close is compared with the high and low of the previous brick (white or black):
-
If the closing price rises above the top of the previous brick by at least the box size, one or more white bricks are drawn in new columns. The height of the bricks is always equal to the box size.
-
If the closing price falls below the bottom of the previous brick by at least the box size, one or more black bricks are drawn in new columns. Again, the height of the bricks is always equal to the box size.
If prices move more than the box size, but not enough to create two bricks, only one brick is drawn. For example, in a two-unit Renko chart, if the prices move from 100 to 103, only one white brick is drawn from 100 to 102. The rest of the move, from 102 to 103, is not shown on the Renko chart.
- Free trading apps
- Over 8,000 signals for copying
- Economic news for exploring financial markets
You agree to website policy and terms of use
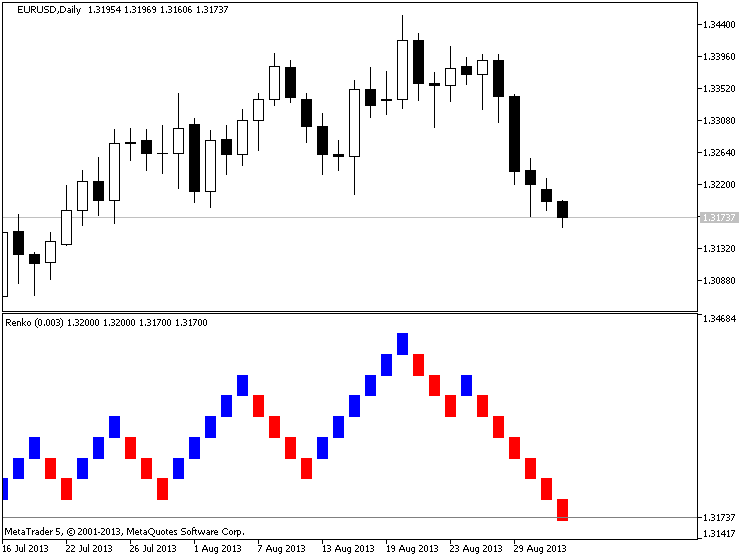
Renko Line Break vs RSI EA:
An Expert Advisor based on two indicators - Renko Line Break and RSI. It trades stop orders.
Author: Serhii Ivanenko