2 MACD in ONE Indicator
Hallo friends,
Please help to code an indi that consists of 2 MACD.
Thanks and Regards,
antonanton
check this post : https://www.mql5.com/en/forum/173574/page380
Hi mladen,
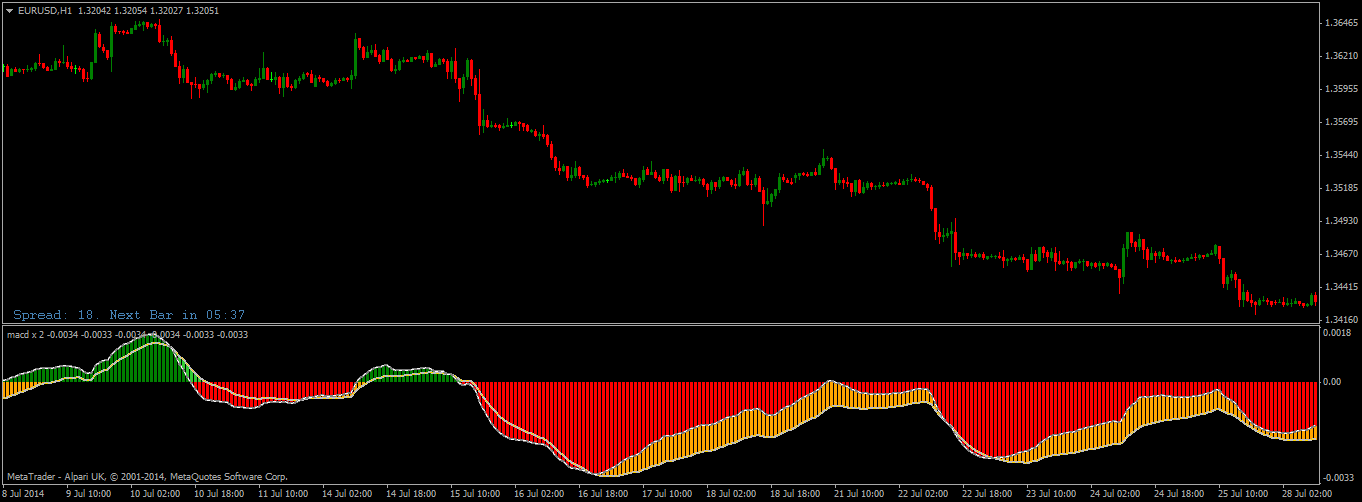
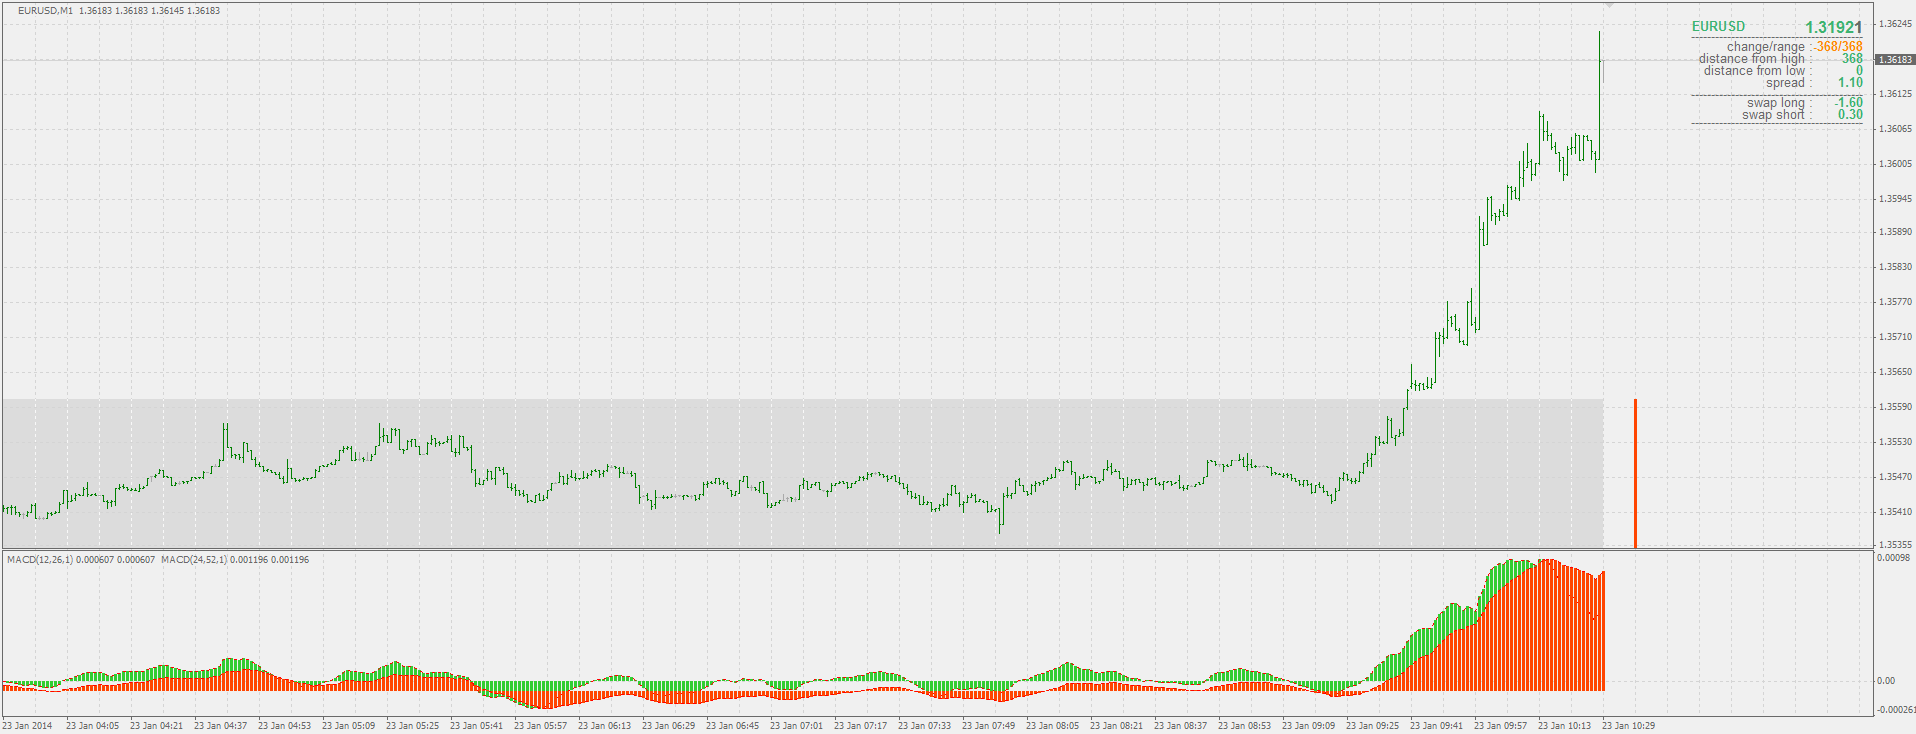
Please see the attached picture using MACDx2 and using 2 MACD manually. There are different crossing line. Please advice.
Thanks and regards,
anton
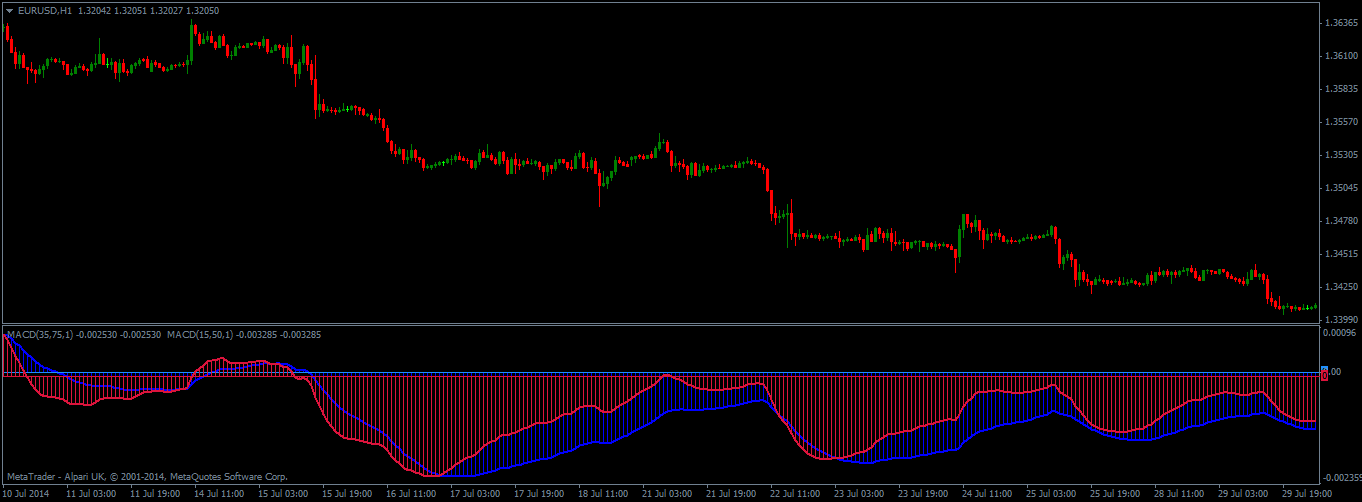
Hi mladen,
Please see the attached picture using MACDx2 and using 2 MACD manually. There are different crossing line. Please advice.
Thanks and regards,
antonanton
Do not compare any normal macd to the build in metatrader macd
Metatrader macd signal line is wrong for years and years and everybody except metatrader knows it. Signal line for metatrader build in macd is sma while the inventor (Gerald Appel) clearly stated that it must be ema - all the regular trading platform except metatrader are using ema not sma. I do not use metatrader built in macd. If you want it to be the same as metatrader "macd" then change sma to ema in these lines :
macd1si = iMAOnArray(macd1ln,0,Macd1Signal,0,MODE_EMA,i);
macd2si = iMAOnArray(macd2ln,0,Macd2Signal,0,MODE_EMA,i);
Other than that I do not see any other difference - just that your charts are shifted differently
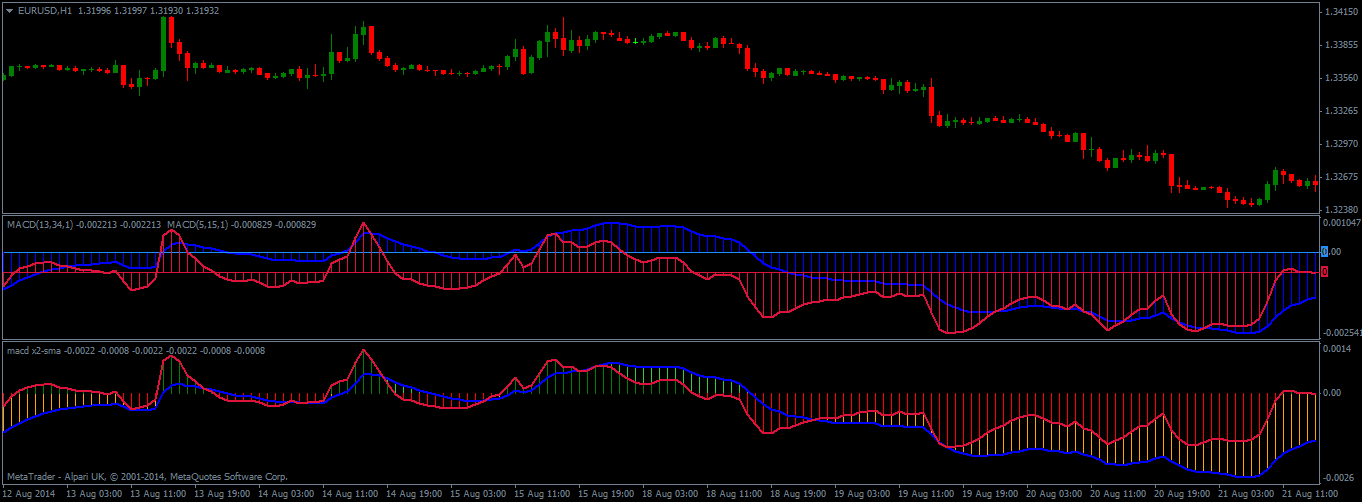
Hi mladen,
I have change the MACD x2 into MACD x2-SMA (the signal change from EMA ot SMA). The result is still different. Please advice.
Thanks and Regards,
antonPlease see the difference in the zero line you have in the example you tried to put together.
You can not attach two MACDs in the same window (zero line will not be the same) - MACD is not like stochastic or RSI that have known upper and lower bound regardless of the periods calculated. With same parameters values are exactly the same (check the values in the data window and you will find that they are the same). Visually set the same minimum and maximum for both indicators in your attempted example (so that the zero lines align) and then you are even visually going to have exactly the same picture)
Hi mladen,
Would you please to code like the manual?
Regards,
anton
Hi mladen,
I am trading it alive by this 2 MACD. the different level of the zero line is very useful. When the candle closed, there is no repainting, same as Moving average.
Please consider to help.
Thanks and Regards,
anton
Hi mladen,
I am trading it alive by this 2 MACD. the different level of the zero line is very useful. When the candle closed, there is no repainting, same as Moving average.
Please consider to help.
Thanks and Regards,
antonanton
They do repaint - it is simply a consequence how metatrader draws multiple indicators without a know minimum and maximum in the same sub-window - nothing at all to do with opened or closed bar and nothing can change that - seen that a million times
_____________________
PS: when zero lines are not aligned you are comparing, for example, 1 and 2, and in some cases it will show that they are the same. As I told already check the data window for the values and compare them manually and you shall see what are you comparing.
Examples :
First snapshot :
And a couple of minutes later :
Check the crosses and check the zero line relation
- Free trading apps
- Over 8,000 signals for copying
- Economic news for exploring financial markets
You agree to website policy and terms of use
Hallo friends,
Please help to code an indi that consists of 2 MACD.
Thanks and Regards,
anton