Collect color of AC oscillator M30 on a M5 chart.
Hello to all,
I need help to know how to collect the color of AC oscillator tf:M30 on a 5M chart.
I want to filter a stochastic 34,3,5 with the AC (M30 chart) on the M5 chart.
To do it with ac on current time frame i used to do :
//STOCH
double Stoch_Main (int i = 0){return(iStochastic(NULL,0,Stoch_K,Stoch_D,Stoch_Slowing,MODE_SMA,0,MODE_MAIN, i));}
double Stoch_Signal (int i = 0){return(iStochastic(NULL,0,Stoch_K,Stoch_D,Stoch_Slowing,MODE_SMA,0,MODE_SIGNAL,i));}
//AC
double AC1 (int i = 0){return(iAC(NULL,TimeFrame,i));}
double AC2 (int i = 0){return(iAC(NULL,TimeFrame,i+1));}
[/CODE]
...
//STOCH
double stochMain =Stoch_Main(i);
double stochSignal =Stoch_Signal(i);
//AC
double ac1 =AC1(i);
double ac2 =AC2(i+1);
...
[CODE]
if(
&& stochMain > stochSignal
&& stochMain < OverboughtSTOCH
&& ac1>ac2
)
If i put TimeFrame=30; It doesn't work properly.
Need help of an experienced coder.
thank you for any help.You already have "i+1" in the AC2 function. Calling the double ac2 =AC2(i+1); gives you iAC(...,i+2) not previous value
Hello,
You are right. thank you for the correction.
But can you show me the solution of my problem please ? I really need it.
Hello,
You are right. thank you for the correction.
But can you show me the solution of my problem please ? I really need it.Replace
double ac2 =AC2(i+1);
with
double ac2 =AC2(i);
and it should work OK
IT doesn't work.
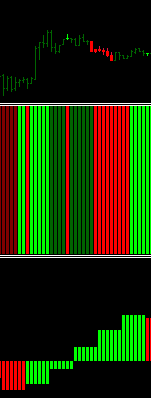
Wee can see a stoch color bar filter.
And below, a M30 AC on M5 chart bar.
It should be no red candles.
(I really don't understand why. I am not an expert coder, but i know coding a little bit.)
Here is my whole code.
what is wrong please ?
//+------------------------------------------------------------------+
//| MadaForex Trends & Entries.mq4 |
//| Copyright © 2014, MadaForex |
//| by MadaForex for the MadaForex System |
//+------------------------------------------------------------------+
#property indicator_chart_window
#property indicator_buffers 4
#property indicator_color1 Lime//wick
#property indicator_color2 Crimson//wick
#property indicator_color3 Chartreuse//candle
#property indicator_color4 Red//candle
#property indicator_width1 1
#property indicator_width2 1
#property indicator_width3 2
#property indicator_width4 2
extern string STOCH = "About STOCH";
extern int Stoch_K = 34;
extern int Stoch_D = 3;
extern int Stoch_Slowing = 5;
extern int OverboughtSTOCH = 80;
extern int OversoldSTOCH = 20;
//---- input parameters
extern string Visual = "About Visual";
extern int BarWidth = 1,
CandleWidth = 2;
extern string AC_AO = "About AC & AO";
extern int TimeFrame = 30;
//---- buffers
double Bar1[],
Bar2[],
Candle1[],
Candle2[];
//+------------------------------------------------------------------+
//| Custom indicator initialization function |
//+------------------------------------------------------------------+
int init()
{
//---- indicators
IndicatorShortName("MadaForex Trends & Entries");
IndicatorBuffers(4);
SetIndexBuffer(0,Bar1);
SetIndexBuffer(1,Bar2);
SetIndexBuffer(2,Candle1);
SetIndexBuffer(3,Candle2);
SetIndexStyle(0,DRAW_HISTOGRAM,0,BarWidth);
SetIndexStyle(1,DRAW_HISTOGRAM,0,BarWidth);
SetIndexStyle(2,DRAW_HISTOGRAM,0,CandleWidth);
SetIndexStyle(3,DRAW_HISTOGRAM,0,CandleWidth);
SetIndexStyle(0,DRAW_HISTOGRAM,0,BarWidth);
SetIndexStyle(1,DRAW_HISTOGRAM,0,BarWidth);
SetIndexStyle(2,DRAW_HISTOGRAM,0,CandleWidth);
SetIndexStyle(3,DRAW_HISTOGRAM,0,CandleWidth);
return(0);
}
//+------------------------------------------------------------------+
//STOCH
double Stoch_Main (int i = 0){return(iStochastic(NULL,0,Stoch_K,Stoch_D,Stoch_Slowing,MODE_SMA,0,MODE_MAIN, i));}
double Stoch_Signal (int i = 0){return(iStochastic(NULL,0,Stoch_K,Stoch_D,Stoch_Slowing,MODE_SMA,0,MODE_SIGNAL,i));}
//AC
double AC1 (int i = 0){return(iAC(NULL,TimeFrame,i));}
double AC2 (int i = 0){return(iAC(NULL,TimeFrame,i+1));}
//+------------------------------------------------------------------+
void SetCandleColor(int col, int i)
{
double high,low,bodyHigh,bodyLow;
{
bodyHigh = MathMax(Open,Close);
bodyLow = MathMin(Open,Close);
high = High;
low = Low;
}
Bar1 = low; Candle1 = bodyLow;
Bar2 = low; Candle2 = bodyLow;
switch(col)
{
case 1: Bar1 = high; Candle1 = bodyHigh; break;
case 2: Bar2 = high; Candle2 = bodyHigh; break;
}
}
//+------------------------------------------------------------------+
//| Custom indicator iteration function |
//+------------------------------------------------------------------+
int start()
{
for(int i = MathMax(Bars-1-IndicatorCounted(),1); i>=0; i--)
{
//STOCH
double stochMain =Stoch_Main(i);
double stochSignal =Stoch_Signal(i);
//AC
double ac1 =AC1(i);
double ac2 =AC2(i);
if(/**/ stochMain > stochSignal
&& stochMain < OverboughtSTOCH
&& ac1>ac2/**/
)
SetCandleColor(1,i);
else if(/**/ stochMain < stochSignal
&& stochMain > OversoldSTOCH
&& ac2>ac1/**/
)
SetCandleColor(2,i);
}
return(0);
}
//+------------------------------------------------------------------+
IT doesn't work.
Wee can see a stoch color bar filter.
And below, a M30 AC on M5 chart bar.
It should be no red candles.
(I really don't understand why. I am not an expert coder, but i know coding a little bit.)MadaForex
That histogram was not produced by this part of code (the code you posted at your post) :
What is the exact code that you used for that? I am afraid that nobody can help you if only some parts of code are disclosed and the rest has to be guessed
No sorry,
I have missexplained the chart.
I am working on a candle chart indicator
I want this candle indicator draw :
- Green candle when stochastic AND ac oscillator M30 (on a M5 chart) are green.
- Red candle when stochastic AND ac oscillator M30 (on a M5 chart) are Red.
The 2 histogramme below are just to verify the candle indicator.
And in the last attached, we can see that there is red candle while the ac mtf is green. S we can see that it doesn't work.
No sorry,
I have missexplained the chart.
I am working on a candle chart indicator
I want this candle indicator draw :
- Green candle when stochastic AND ac oscillator M30 (on a M5 chart) are green.
- Red candle when stochastic AND ac oscillator M30 (on a M5 chart) are Red.
The 2 histogramme below are just to verify the candle indicator.
And in the last attached, we can see that there is red candle while the ac mtf is green. S we can see that it doesn't work.Try it out now : _test.mq4
Yes.
Thank you very very much. It's exactly the wanted result.
As you can see on the code, i desired to add the AO oscillator in the same way.
I have done easily with your help.
Thank you again and see you soon in the forum.
- Free trading apps
- Over 8,000 signals for copying
- Economic news for exploring financial markets
You agree to website policy and terms of use
Hello to all,
I need help to know how to collect the color of AC oscillator tf:M30 on a 5M chart.
I want to filter a stochastic 34,3,5 with the AC (M30 chart) on the M5 chart.
To do it with ac on current time frame i used to do :
//STOCH
double Stoch_Main (int i = 0){return(iStochastic(NULL,0,Stoch_K,Stoch_D,Stoch_Slowing,MODE_SMA,0,MODE_MAIN, i));}
double Stoch_Signal (int i = 0){return(iStochastic(NULL,0,Stoch_K,Stoch_D,Stoch_Slowing,MODE_SMA,0,MODE_SIGNAL,i));}
//AC
double AC1 (int i = 0){return(iAC(NULL,TimeFrame,i));}
double AC2 (int i = 0){return(iAC(NULL,TimeFrame,i+1));}
[/CODE]
...
//STOCH
double stochMain =Stoch_Main(i);
double stochSignal =Stoch_Signal(i);
//AC
double ac1 =AC1(i);
double ac2 =AC2(i+1);
...
[CODE]
if(
&& stochMain > stochSignal
&& stochMain < OverboughtSTOCH
&& ac1>ac2
)
If i put TimeFrame=30; It doesn't work properly.
Need help of an experienced coder.
thank you for any help.