Daily Technical Outlook FXTM
Daily Technical Outlook -October 27-
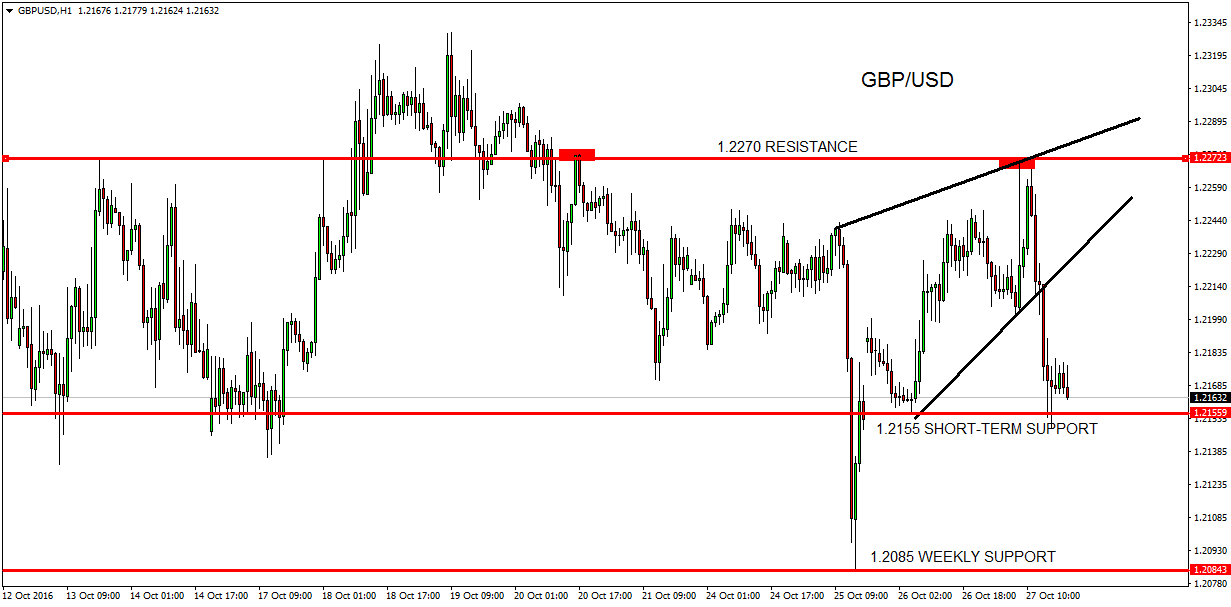
GBP/USD
Cable succeed to jump during the European trading session today, boosted by strong GDP figures in the U.K and we have seen the pair reaching a high of 1.2270 before to retreat sharply in the U.S session.
In the coming hours, a downside continuation is likely as the Sterling remain weak below 1.2330 peak. Consequently, any rally is likely to be temporary and the we should see another attempt to break below 1.2155 daily support soon.
In the short-term, the next levels of interest stand between 1.2195/1.2200 zone and we should see strong sellers around these levels if the pair manage to bounce overnight. While in the downside, a breakdown below 1.2155 support may clear the path for as low as 1.2080.
Daily Technical Outlook -October 27-
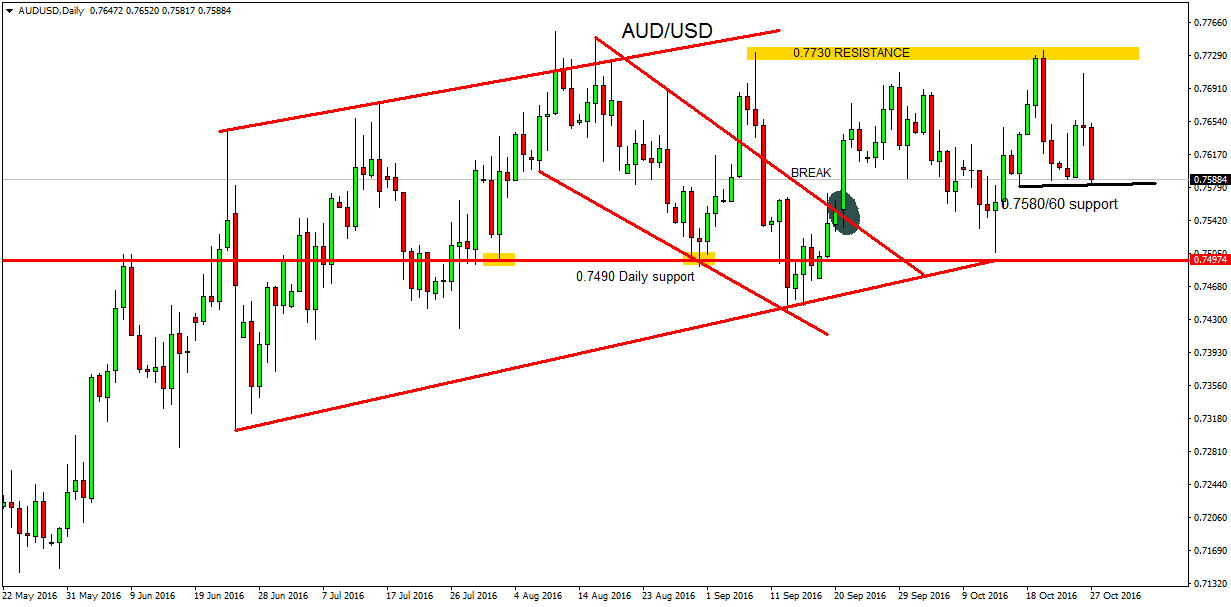
AUD/USD
The Australian Dollar recent rally stalled around 0.7700 psychological barrier yesterday as prices showed a strong negative rejection candle in the daily chart, which reinforced the odds of a potential bearish reversal today.
For the time being, the pair is testing a major support level located at 0.7585 level and a clear breakdown below it will confirm that the hourly chart has turned bearish again. Meanwhile, further weakness is expected in the following hours, which can send the pair towards 0.7500 handle.
From a wider angle, the Aussie still bullish as the technical picture is showing an intact higher low structure that began from 0.7143 low. However, when looking at the RSI indicator, a hidden bearish divergence can be a heavy signal about a strong retracement to the downside yet to come.
In the opposite, a 4-hour close above 0.7635 resistance will invalidate the current expectations.
Daily Technical Outlook -October 27-
USD/CAD
The pair broke above its daily range that kept prices sideways for more than two-month. Prices overtook 1.3300 barrier which represented the upper side of the recent rangebound, sending a clear message to traders that the pair is likely to extend its positive momentum towards the 1.3450 resistance zone.
With that in mind, buying the dips was the preferred strategy for most of market participants despite yesterday’s drop following crude Oil inventories. The pair fell to reach a low at 1.3315 which coincide with the 61.8% retracement of the entire cycle that comes from 1.3380 peak to 1.3276 low before to begin another wave to the upside, reinforcing the bullish outlook in USD/CAD.
As we can see, the higher low/ higher high structure remains clear and as far as 1.3276 support is in place, new highs for the month of October are expected and traders should focus on 1.3450 resistance as an ideal target to end a bullish cycle in the 4-hour chart.

Daily Technical Outlook -October 27-
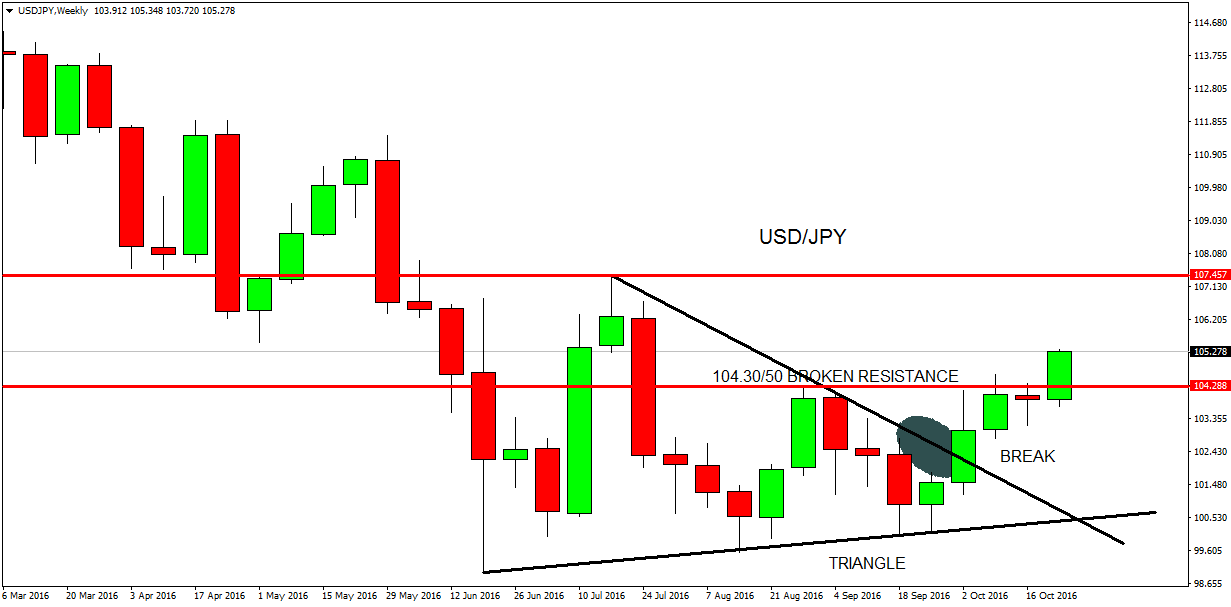
USD/JPY
The pair turned positive in the daily chart for the first time in more than 6-month as prices succeed to break above 104.50 resistance zone. A weekly close above this resistance should increase the probability for a re-test of 107.50 barrier.
As of now we will watch 105.60-106.30 resistance zone carefully, as it represents the profit taking area for bulls which may lead to a deeper correction in the coming days. However, the trend is likely to remain bullish above 104.00 psychological support.
In the flipside, a daily close below 104.00 support, is likely to extend the decline towards 103.50 followed by 103.15 support in extension.
To conclude, the pair managed to break the bearish trendline that comes from 111.60 high in the weekly chart, in addition the recent price action took the form of a consolidation triangle that confirmed the bullish reversal as prices broke higher from this pattern.
Daily Technical Outlook -October 27-
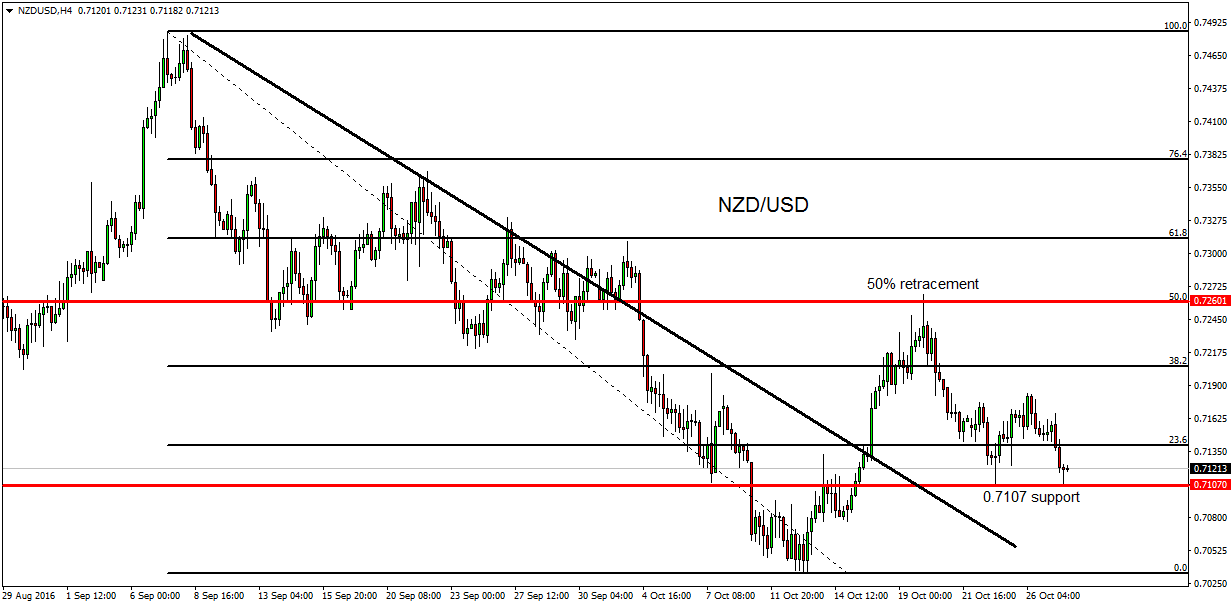
NZD/USD
The Kiwi sold-off from 0.7260 level as expected, which represent the 50% retracement of the entire cycle that comes from 0.7482 peak to 0.7031 low. Therefore, a pause in the bullish momentum is likely, and the pair may enter into a short-term corrective phase.
In the hourly chart, the pair broke below 0.7130 support level and for the time being, another acceleration in the direction of 0.7025 weekly support is highly anticipated. In the other side, an hourly close above 0.7184 peak is needed to confirm a new rally in the direction of 0.7306 resistance.
Regarding the short-term price action, a breakdown below 0.7107 support should be the trigger for further decline in the direction of 0.7075 followed by 0.7025 weekly support as mentioned above.
Daily Technical Outlook 31-10 to 4-11-2016
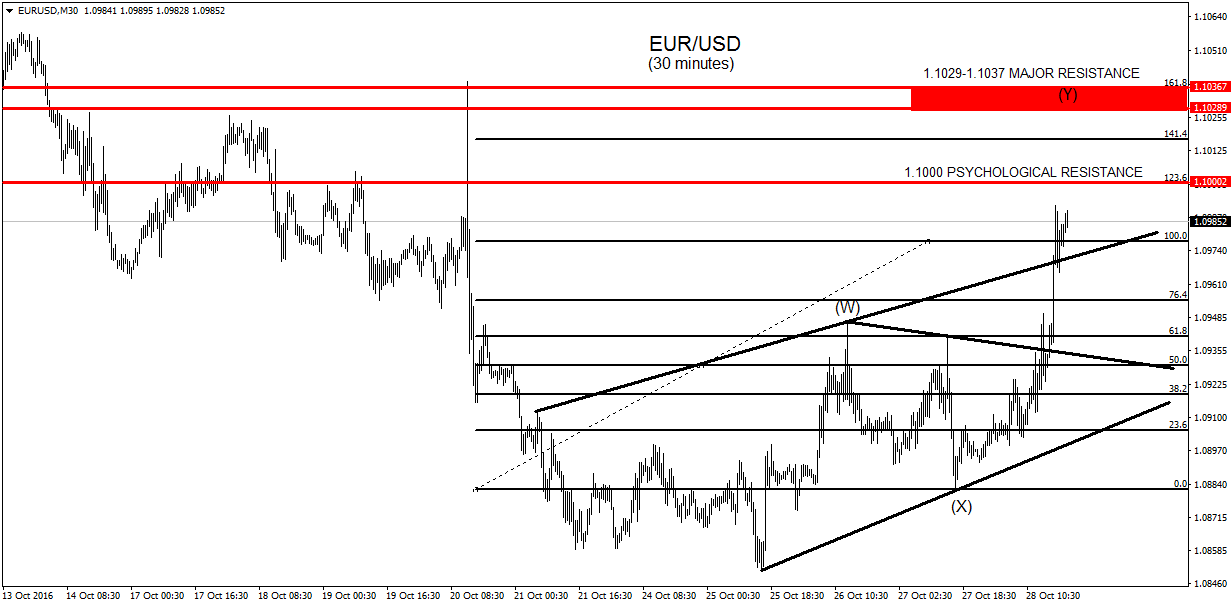
EUR/USD
The Euro ended last week in the positive territory after we saw strong support around the 1.0850 area. Looking at the technical picture for this pair, we can see that the daily trend remains below 1.1280 peak, therefore the current recovery is likely to be short-lived.
Regarding the short-term price action, the single currency showed a double zigzag corrective pattern with another extension higher in the focus that can reach as high as 1.1030/40 before the decline resume. In the meantime, a clear bullish engulfing candle emerged in the weekly chart, which reinforces the probability of a larger correction to the upside in the coming days. As of the week ahead, traders should focus on the mentioned above resistance zone, from where strong sellers may appear. In extension, a daily close above this zone, should clear the path for a re-test of the 50-61.8% retracement from 1.1280 high, located between 1.1065-1.1116. In the opposite, a daily close below 1.0900-1.0880 zone is needed to confirm that the bearish momentum renewed.
Daily Technical Outlook 31-10 to 4-11-2016
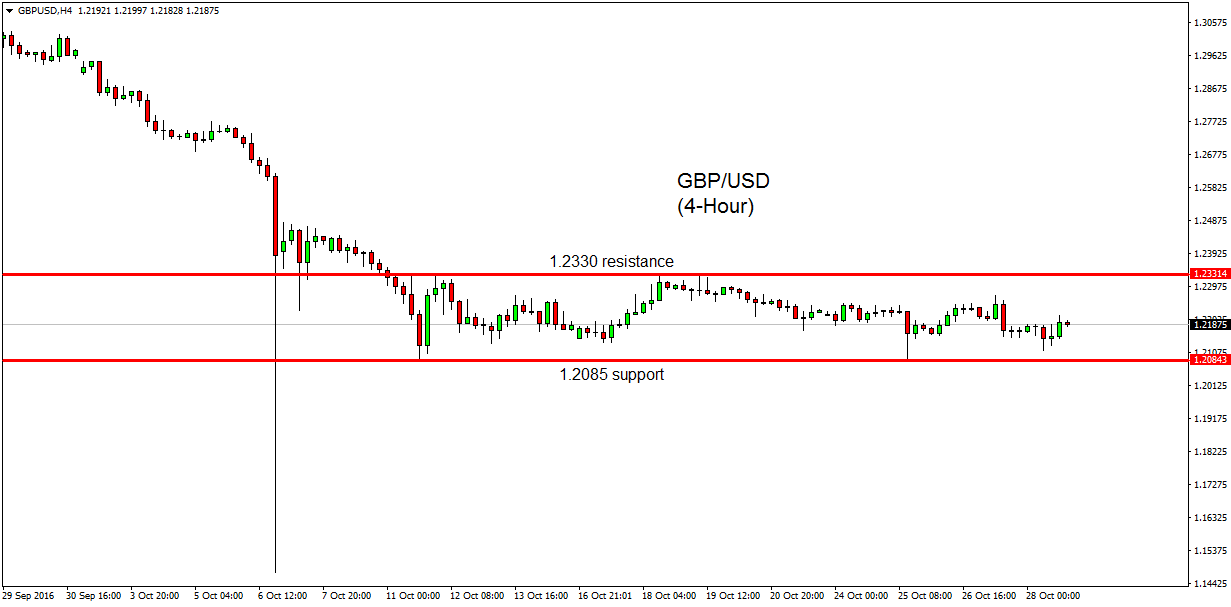
GBP/USD
Cable continue to trade sideways in the hourly chart between 1.2330 in the upside and 1.2085 support in the downside, which keeps the short-term view unclear for the time being.
Meanwhile, we will focus on 1.2113 support level in the coming days as it represents Friday low and a breakdown below it may trigger another decline towards the major support of 1.2085, while a daily close below this figure will confirm a big plunge in the British pound for the days ahead.
In the other side, a move back above 1.2200 handle will expose 1.2250/70 resistance zone while a daily close above it should confirm a temporary bottom in this pair, and at that time another rally in the direction of 1.2330 peak cannot be ruled out.
Overall, the short-term trend is neutral in this pair, consequently, we should wait for the break of one of those key technical levels to get more clues about the future possible price action.
4-HOUR CHART:
1HOUR CHART :

Daily Technical Outlook 31-10 to 4-11-2016
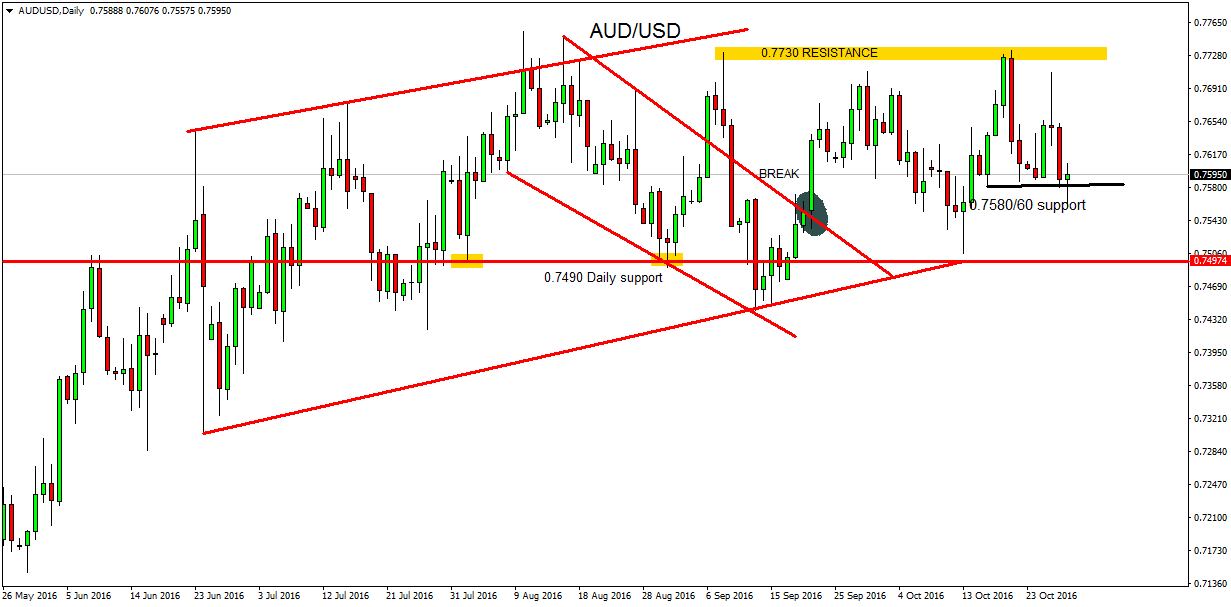
AUD/USD
The Australian Dollar recent rally stalled around 0.7700 psychological barrier on Wednesday, despite strong inflation data in Australia, which reinforced the odds of a potential bearish reversal recently.
However, as far as 0.7500 support is in place, the pair may continue to trade sideways in the coming days until a breakdown below this major support happens. In the near-term, momentum indicators remain in the negative territory.
Technically, a correction to the upside may find strong sellers around 0.7605-0.7616 zone as bears are likely to protect 0.7652 hourly barrier, in the opposite, only a breakout above this level should unwind the recent downside pressure.
To summarize, the trend remains neutral in the daily chart while the hourly chart still bearish.
Daily Technical Outlook 31-10 to 4-11-2016
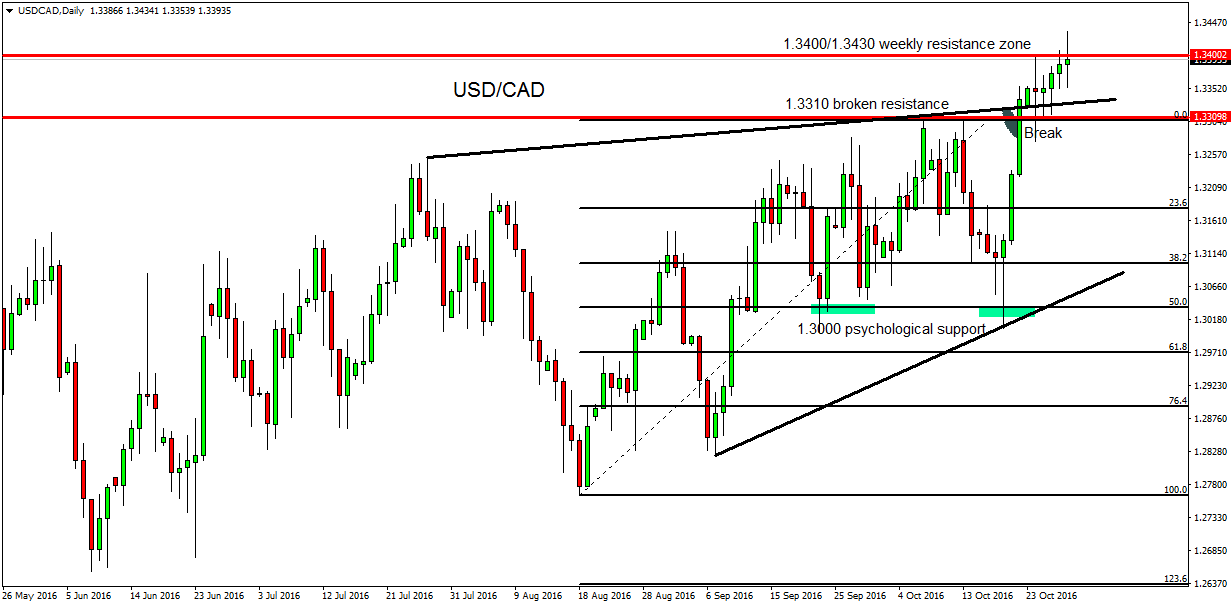
USD/CAD
The pair traded in line with our expectations during the previous week and prices managed to extend its gains above 1.3400 handle. As of now, we may see some correction to the downside in early Asian trading, that can offer new buying opportunities for bulls.
The bullish cycle in the daily chart is not over yet, and we can see another acceleration towards 1.3450 zone as far as the pair continue to trade above 1.3310 low. In the short-term, 1.3370/50 levels turned support, and we will wait to see the market reaction once we reach this zone in the coming hours.
From a wider angle, the pair still bullish as the price action from 1.2760 support is showing that the preference remain in favor of buying the dips. USD/CAD is showing a clean higher-low structure from 1.3000 support (Post-Boc low) and over the med-term the outlook will remain positive above this psychological support.
Daily Technical Outlook 31-10 to 4-11-2016
USD/JPY
The pair turned positive in the daily chart for the first time in more than 6-month as prices succeed to break above 104.50 resistance zone. The probability for a re-test of 107.50 barrier remain high, however key technical resistance zone was reached during last week, which stands between 105.55 and 106.00, consequently a deeper correction to the downside is highly anticipated in the beginning of this week before the bullish trend resume.
As of now, we will watch 104.13-103.80 support zone carefully, as it represents the nearest support area for bulls. In the flipside, a daily close below the mentioned above support zone, is likely to extend the decline towards 103.50 followed by 103.15 support in extension.
To conclude, the pair managed to break the bearish trendline that comes from 111.60 high in the weekly chart, in addition the recent price action took the form of a consolidation triangle that confirmed the bullish reversal as prices broke higher from this pattern. Therefore, unless we see a weekly close below 102.80 support, the upside momentum will remain strong.

- Free trading apps
- Over 8,000 signals for copying
- Economic news for exploring financial markets
You agree to website policy and terms of use
EUR/USD
The Euro bounced during yesterday after reaching a major support located at 1.0850 in the weekly chart. However, the current recovery can be short-lived as long as prices continue to trade below 1.1040peak, which represents the post-ECB high.
Looking at near-term price action, the single currency is likely to extend its correction to around 1.0965/1.0986 resistance zone, before a new impulsive to the downside begin.
In the meantime, another scenario should be in mind, if prices manage to hold below yesterday peak, which stands at 1.0945, then another dip below 1.0890-70 support zone can be expected.
Overall, the pair remain under pressure from a med-term standpoint, and only a daily close above 1.1040 level will cancel this negative outlook.
More Information Here