Intra Day Trading - page 36
You are missing trading opportunities:
- Free trading apps
- Over 8,000 signals for copying
- Economic news for exploring financial markets
Registration
Log in
You agree to website policy and terms of use
If you do not have an account, please register
EUR/USD DAILYas ofTuesday, 01 December, 2015
*** Intra-Daily Trading Strategy: BUYEuro Dollar / US Dollar
Buy Target: 1.0580
Enter New BUY on OPEN and exit BUY positions at Target price or at Stop price.
(NOTE: Adjust Stop Loss Price according to your trading risk.)
Do not reverse after exiting. This is a recommendation for INTRA-DAY TRADING only!!!!!
A black body has formed as prices closed lower than open.
The previous 10 candlestick bars, there are 3 white candles versus 6 black candles with a net of 3 black candles.
The previous 50 candlestick bars, there are 21 white candles versus 28 black candles with a net of 7 black candles.
Three black candles has formed during the last three bars. Although these candles were not big enough to create three black crows, the steady downward pattern is bearish.MACD is BULLISH as the MACD is above the signal line.
The MACD crossedabove the signal line 1 day(s) ago. Since the MACD crossed the MACD moving average, Euro Dollar / US Dollar's price has decreased 0.24%, and has been fluctuating from a high of 1.064 to a low of 1.056.
The MACD is currently not in an Overbought/Oversold range.
There have been no divergencesignals during the last 5 periods.
The Stochastic Oscillatoris currently below 20. This is an indication of the security being in an "oversold" condition. No Stochastic Buy or Sell signals generated today. The last signal was a Sell 31 Day(s) Ago.
The RSI is below 30. This is where it usually bottoms. The RSI usually forms tops and bottoms before the underlying security. A buy or sell signal generated when the RSI moves out of an overbought/oversold area. The last signal was a Buy 8 day(s) ago.
Currently the RSI does not show any Failure Swings. The price of Euro Dollar / US Dollar has set a new 14-period low while the RSI has not. This is a BULLISH DIVERGENCE.
Currently, the Momentum Oscillator does not show an overbought or oversold condition.
The last Directional Movement Indicators (DMI) signal was a SELL 169 day(s) ago.
There were no SAR signals generated today. The last SAR signal was a Sell 27 day(s) ago.
The close is currently
BELOW its 200 daily moving average
BELOW its 50 daily moving average
BELOW its 20 daily moving average
The current market condition for Euro Dollar / US Dollar is Very Bearish
Euro Dollar / US Dollar closed above the lower Bollinger Band by 13.9%. Bollinger Bands are 25.92% narrower than normal. The current width of the Bollinger Bands (alone) does not suggest anything conclusive about the future volatility or movement of prices.
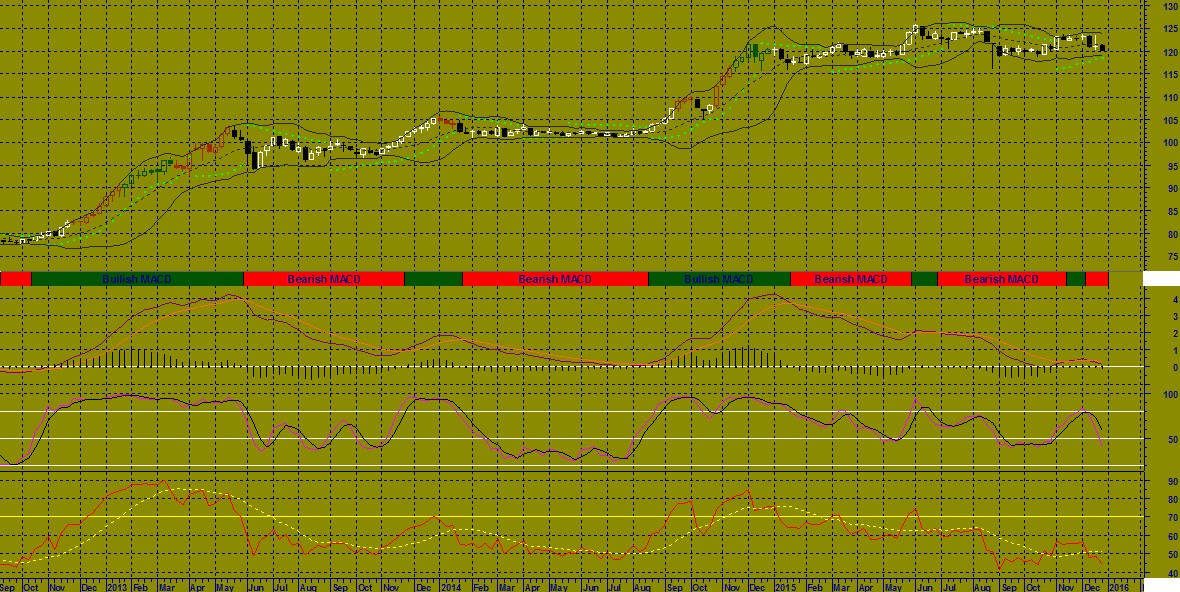
USD/JPY WEEKLY as of Monday, 07 December, 2015
A black body has formed as prices closed lower than open.
The previous 10 candlestick bars, there are 4 white candles versus 6 black candles with a net of 2 black candles.
The previous 50 candlestick bars, there are 26 white candles versus 24 black candles with a net of 2 white candles.
MACD is BULLISH as the MACD is above the signal line.
The MACD crossedabove the signal line 2 week(s) ago. Since the MACD crossed the MACD moving average, US Dollar / Japanese Yen's price has increased 0.26%, and has been fluctuating from a high of 123.741 to a low of 122.253.
The MACD is currently not in an Overbought/Oversold range.
There have been no divergencesignals during the last 5 periods.
The Stochastic Oscillatoris currently above 80. This is an indication of the security being in an "overbought" condition. No Stochastic Buy or Sell signals generated today. The last signal was a Sell 160 Week(s) Ago.
The RSI is not currently in a topping (above 70) or bottoming (below 30) range. A buy or sell signal generated when the RSI moves out of an overbought/oversold area. The last signal was a Sell 25 week(s) ago.
Currently the RSI does not show any Failure Swings. The RSI and price of US Dollar / Japanese Yen are not diverging.
Currently, the Momentum Oscillator does not show an overbought or oversold condition.
The Directional Movement Indicators (DMI) currently is not indicating a specific price direction. Because this is a trend following system, it should not use to initiate any trades right now. The last Directional Movement Indicators (DMI) signal was a SELL 14 week(s) ago.
There were no SAR signals generated today. The lastSAR signal was a Buy 4 week(s) Ago.
The close is currently
ABOVE its 200 weekly moving average
ABOVE its 50 weekly moving average
ABOVE its 20 weekly moving average
The current market condition for US Dollar / Japanese Yen is Very Bullish
US Dollar / Japanese Yen closed below the upper Bollinger Band by 30.3%. Bollinger Bands are 27.22% narrower than normal. The current width of the Bollinger Bands (alone) does not suggest anything conclusive about the future volatility or movement of prices.
GBP/USD DAILY as of Wednesday, 09 December, 2015
*** Intra-Daily Trading Strategy: BUYBritish Pound / US Dollar
Buy Target: 1.5059
Enter New BUY on OPEN and exit BUY positions at Target price or at Stop price.
(NOTE: Adjust Stop Loss Price according to your trading risk.)
Do not reverse after exiting. This is a recommendation for INTRA-DAY TRADING only!!!!!
A black body has formed as prices closed lower than open.
The previous 10 candlestick bars, there are 4 white candles versus 6 black candles with a net of 2 black candles.
The previous 50 candlestick bars, there are 20 white candles versus 28 black candles with a net of 8 black candles.
Three black candles has formed during the last three bars. Although these candles were not big enough to create three black crows, the steady downward pattern is bearish.MACD is BEARISH as the MACD is below the signal line.
The MACD crossedbelow the signal line 11 period(s) ago. Since the MACD crossed the MACD moving average, British Pound / US Dollar's price has decreased 0.79%, and has been fluctuating from a high of 1.519 to a low of 1.490.
The MACD is currently not in an Overbought/Oversold range.
There have been no divergencesignals during the last 5 periods.
No Stochastic Buy or Sell signals generated today. The last signal was a Sell 33 Period(s) Ago.
The RSI is not currently in a topping (above 70) or bottoming (below 30) range. A buy or sell signal generated when the RSI moves out of an overbought/oversold area. The last signal was a Buy 66 period(s) ago.
Currently the RSI does not show any Failure Swings. The RSI and price of British Pound / US Dollar are not diverging.
Currently, the Momentum Oscillator does not show an overbought or oversold condition.
The Directional Movement Indicators (DMI) currently is not indicating a specific price direction. Because this is a trend following system, it should not use to initiate any trades right now. The last Directional Movement Indicators (DMI) signal was a BUY 133 period(s) ago.
There were no SAR signals generated today. The last SAR signal was a Sell 23 period(s) ago.
The close is currently
BELOW its 200 daily moving average
BELOW its 50 daily moving average
BELOW its 20 daily moving average
The current market condition for British Pound / US Dollar is Very Bearish
British Pound / US Dollar closed above the lower Bollinger Band by 14.9%. Bollinger Bands are 34.64% narrower than normal. The current width of the Bollinger Bands (alone) does not suggest anything conclusive about the future volatility or movement of prices.
Euro Dollar / US Dollar-EURUSDAs of 14/12/15
*** Intra-Daily Trading Strategy: BUYEuro Dollar / US Dollar
Buy Target: 1.1048
Enter NewBUYon OPEN and exitBUYpositions at Target price or at Stop price.
(NOTE: Adjust Stop Loss Price according to your trading risk.)
Do not reverse after exiting. This is a recommendation for INTRA-DAY TRADING only!!!!!
A white body has formed as prices closed higher than open.
The previous 10 candlestick bars, there are 6 white candles versus 4 black candles with a net of 2 white candles.
The previous 50 candlestick bars, there are 22 white candles versus 27 black candles with a net of 5 black candles.
A spinning top has formed which is a candle with a small real body. Spinning tops identify a session in which there is little price action as defined by the difference between the open and the close. During a rally or near new highs, a spinning top can be a sign that prices are losing momentum and the bulls may be in trouble.MACD is BULLISH as the MACD is above the signal line.
The MACD crossedabove the signal line 11 day(s) ago. Since the MACD crossed the MACD moving average, Euro Dollar / US Dollar's price has increased 3.81%, and has been fluctuating from a high of 1.105 to a low of 1.053.
The MACD is currently not in an Overbought/Oversold range.
There have been no divergencesignals during the last 5 periods.
The Stochastic Oscillatoris currently above 80. This is an indication of the security being in an "overbought" condition. No Stochastic Buy or Sell signals generated today. The last signal was a Sell 41 Day(s) Ago.
The RSI is not currently in a topping (above 70) or bottoming (below 30) range. A buy or sell signal generated when the RSI moves out of an overbought/oversold area. The last signal was a Buy 9 day(s) ago.
Currently the RSI does not show any Failure Swings. The RSI and price of Euro Dollar / US Dollar are not diverging.
Currently, the Momentum Oscillator does not show an overbought or oversold condition.
The last Directional Movement Indicators (DMI) signal was a BUY 7 day(s) ago.
There were no SAR signals generated today. The lastSAR signal was a Buy 7 day(s) Ago.
The close is currently
BELOW its 200 daily moving average
ABOVE its 50 daily moving average
ABOVE its 20 daily moving average
The current market condition for Euro Dollar / US Dollar is Mildly Bearish
Euro Dollar / US Dollar closed below the upper Bollinger Band by 10.5%. Bollinger Bands are 10.36% wider than normal. The current width of the Bollinger Bands (alone) does not suggest anything conclusive about the future volatility or movement of prices.
*** Intra-Daily Trading Strategy: SELLBritish Pound / US Dollar
Sell Target:1.4984
Enter NewSELLon OPEN and exitSELLpositions at Target price or at Stop price.
(NOTE: Adjust Stop Loss Price according to your trading risk.)
Do not reverse after exiting. This is a recommendation for INTRA-DAY TRADING only!!!!!
A black body has formed as prices closed lower than open.
The previous 10 candlestick bars, there are 3 white candles versus 7 black candles with a net of 4 black candles.
The previous 50 candlestick bars, there are 20 white candles versus 28 black candles with a net of 8 black candles.
MACD is BULLISH as the MACD is above the signal line.
The MACD crossedabove the signal line 4 day(s) ago. Since the MACD crossed the MACD moving average, British Pound / US Dollar's price has decreased 0.90%, and has been fluctuating from a high of 1.524 to a low of 1.500.
The MACD is currently not in an Overbought/Oversold range.
There have been no divergencesignals during the last 5 periods.
A Stochastic SELL signal was generated today.
The Stochasticindicator is currently generating a SELL signal against the direction of the major trend.The RSI is not currently in a topping (above 70) or bottoming (below 30) range. A buy or sell signal generated when the RSI moves out of an overbought/oversold area. The last signal was a Buy 71 day(s) ago.
Currently the RSI does not show any Failure Swings. The RSI and price of British Pound / US Dollar are not diverging.
Currently, the Momentum Oscillator does not show an overbought or oversold condition.
The ADX is currently below both Plus and Minus Directional indicators. This should not use to initiate any trades right now.
The Directional Movement Indicators (DMI) currently is not indicating a specific price direction. Because this is a trend following system, it should not use to initiate any trades right now. The last Directional Movement Indicators (DMI) signal was a BUY 138 day(s) ago.
There were no SAR signals generated today. The lastSAR signal was a Buy 4 day(s) Ago.
The close is currently
BELOW its 200 daily moving average
BELOW its 50 daily moving average
BELOW its 20 daily moving average
The current market condition for British Pound / US Dollar is Very Bearish
British Pound / US Dollar closed above the lower Bollinger Band by 27.0%. Bollinger Bands are 41.24% narrower than normal. The narrow width of the Bollinger Bands suggests low volatility as compared to British Pound / US Dollar's normal range. Therefore, the probability of volatility increasing with a sharp price move has increased for the near-term. The Bollinger Bands have been in this narrow range for 1 day(s). The probability of a significant price move increases the longer the Bollinger Bands remain in this narrow range.
*** Intra-Daily Trading Strategy: BUYUS Dollar / Japanese Yen
Buy Target: 122.8173
Enter NewBUYon OPEN and exitBUYpositions at Target price or at Stop price.
(NOTE: Adjust Stop Loss Price according to your trading risk.)
Do not reverse after exiting. This is a recommendation for INTRA-DAY TRADING only!!!!!
A white body has formed as prices closed higher than open.
The previous 10 candlestick bars, there are 6 white candles versus 4 black candles with a net of 2 white candles.
The previous 50 candlestick bars, there are 29 white candles versus 21 black candles with a net of 8 white candles.
Three white candles has formed during the last three bars. Although these candles were not big enough to create three white soldiers, the steady upward pattern is bullish.MACD is BEARISH as the MACD is below the signal line.
The MACD crossedbelow the signal line 16 day(s) ago. Since the MACD crossed the MACD moving average, US Dollar / Japanese Yen's price has decreased 0.07%, and has been fluctuating from a high of 123.667 to a low of 120.342.
The MACD is currently not in an Overbought/Oversold range.
There have been no divergencesignals during the last 5 periods.
No Stochastic Buy or Sell signals generated today. The last signal was a Buy 2 Day(s) Ago.
The RSI is not currently in a topping (above 70) or bottoming (below 30) range. A buy or sell signal generated when the RSI moves out of an overbought/oversold area. The last signal was a Sell 19 day(s) ago.
Currently the RSI does not show any Failure Swings. The RSI and price of US Dollar / Japanese Yen are not diverging.
Currently, the Momentum Oscillator does not show an overbought or oversold condition.
The last Directional Movement Indicators (DMI) signal was a BUY 31 day(s) ago.
There were no SAR signals generated today. The last SAR signal was a Sell 5 day(s) ago.
The close is currently
ABOVE its 200 daily moving average
ABOVE its 50 daily moving average
ABOVE its 20 daily moving average
The current market condition for US Dollar / Japanese Yen is Very Bullish
US Dollar / Japanese Yen closed above the lower Bollinger Band by 47.3%. Bollinger Bands are 18.09% narrower than normal. The current width of the Bollinger Bands (alone) does not suggest anything conclusive about the future volatility or movement of prices.
As of 18/12/15
*** Intra-Weekly Trading Strategy: BUYUS Dollar / Japanese Yen
Buy Target: 122.9953
Buy Stop: 118.4727
Enter NewBUYon OPEN and exitBUYpositions at Target price or at Stop price.
(NOTE: Adjust Stop Loss Price according to your trading risk.)
Do not reverse after exiting. This is a recommendation for INTRA-DAY TRADING only!!!!!
A white body has formed as prices closed higher than open.
The previous 10 candlestick bars, there are 4 white candles versus 6 black candles with a net of 2 black candles.
The previous 50 candlestick bars, there are 26 white candles versus 24 black candles with a net of 2 white candles.
A long upper shadow has formed. This is typically a bearish signal (particularly when it occurs near a high price level, at resistance level, or when the security is overbought).MACD is BEARISH as the MACD is below the signal line.
The MACD crossedbelow the signal line 1 week(s) ago. Since the MACD crossed the MACD moving average, US Dollar / Japanese Yen's price has increased 0.13%, and has been fluctuating from a high of 123.538 to a low of 120.342.
The MACD is currently not in an Overbought/Oversold range.
There have been no divergencesignals during the last 5 periods.
No Stochastic Buy or Sell signals generated today. The last signal was a Sell 162 Week(s) Ago.
The RSI is not currently in a topping (above 70) or bottoming (below 30) range. A buy or sell signal generated when the RSI moves out of an overbought/oversold area. The last signal was a Sell 27 week(s) ago.
Currently the RSI does not show any Failure Swings. The RSI and price of US Dollar / Japanese Yen are not diverging.
Currently, the Momentum Oscillator does not show an overbought or oversold condition.
The Directional Movement Indicators (DMI) currently is not indicating a specific price direction. Because this is a trend following system, it should not use to initiate any trades right now. The last Directional Movement Indicators (DMI) signal was a SELL 16 week(s) ago.
There were no SAR signals generated today. The lastSAR signal was a Buy 6 week(s) Ago.
The close is currently
ABOVE its 200 weekly moving average
ABOVE its 50 weekly moving average
BELOW its 20 weekly moving average
The current market condition for US Dollar / Japanese Yen is Bullish
US Dollar / Japanese Yen closed above the lower Bollinger Band by 43.5%. Bollinger Bands are 33.73% narrower than normal. The current width of the Bollinger Bands (alone) does not suggest anything conclusive about the future volatility or movement of prices.
*** Intra-Daily Trading Strategy: BUYEuro Dollar / US Dollar
Buy Target: 1.0947
Enter NewBUYon OPEN and exitBUYpositions at Target price or at Stop price.
(NOTE: Adjust Stop Loss Price according to your trading risk.)
Do not reverse after exiting. This is a recommendation for INTRA-DAY TRADING only!!!!!
A white body has formed as prices closed higher than open.
The previous 10 candlestick bars, there are 6 white candles versus 4 black candles with a net of 2 white candles.
The previous 50 candlestick bars, there are 21 white candles versus 28 black candles with a net of 7 black candles.
MACD is BULLISH as the MACD is above the signal line.
The MACD crossedabove the signal line 16 day(s) ago. Since the MACD crossed the MACD moving average, Euro Dollar / US Dollar's price has increased 3.00%, and has been fluctuating from a high of 1.106 to a low of 1.053.
The MACD is currently not in an Overbought/Oversold range.
There have been no divergencesignals during the last 5 periods.
No Stochastic Buy or Sell signals generated today. The last signal was a Sell 3 Day(s) Ago.
The RSI is not currently in a topping (above 70) or bottoming (below 30) range. A buy or sell signal generated when the RSI moves out of an overbought/oversold area. The last signal was a Buy 14 day(s) ago.
Currently the RSI does not show any Failure Swings. The RSI and price of Euro Dollar / US Dollar are not diverging.
Currently, the Momentum Oscillator does not show an overbought or oversold condition.
The last Directional Movement Indicators (DMI) signal was a BUY 12 day(s) ago.
There were no SAR signals generated today. The lastSAR signal was a Buy 12 day(s) Ago.
The close is currently
BELOW its 200 daily moving average
ABOVE its 50 daily moving average
ABOVE its 20 daily moving average
The current market condition for Euro Dollar / US Dollar is Mildly Bearish
Euro Dollar / US Dollar closed below the upper Bollinger Band by 33.0%. Bollinger Bands are 10.93% wider than normal. The current width of the Bollinger Bands (alone) does not suggest anything conclusive about the future volatility or movement of prices.
*** Intra-Daily Trading Strategy: SELLBritish Pound / US Dollar
Sell Target:1.4783
Enter NewSELLon OPEN and exitSELLpositions at Target price or at Stop price.
(NOTE: Adjust Stop Loss Price according to your trading risk.)
Do not reverse after exiting. This is a recommendation for INTRA-DAY TRADING only!!!!!
A black body has formed as prices closed lower than open.
The previous 10 candlestick bars, there are 2 white candles versus 8 black candles with a net of 6 black candles.
The previous 50 candlestick bars, there are 17 white candles versus 31 black candles with a net of 14 black candles.
Three black candles has formed during the last three bars. Although these candles were not big enough to create three black crows, the steady downward pattern is bearish.MACD is BEARISH as the MACD is below the signal line.
The MACD crossedbelow the signal line 3 day(s) ago. Since the MACD crossed the MACD moving average, British Pound / US Dollar's price has decreased 0.70%, and has been fluctuating from a high of 1.500 to a low of 1.480.
The MACD is currently not in an Overbought/Oversold range.
There have been no divergencesignals during the last 5 periods.
The Stochastic Oscillatoris currently below 20. This is an indication of the security being in an "oversold" condition. No Stochastic Buy or Sell signals generated today. The last signal was a Sell 5 Day(s) Ago.
The RSI is not currently in a topping (above 70) or bottoming (below 30) range. A buy or sell signal generated when the RSI moves out of an overbought/oversold area. The last signal was a Buy 76 day(s) ago.
The RSI has just reached its lowest value in the last 14 day(s). This is BEARISH signal.
Currently, the Momentum Oscillator does not show an overbought or oversold condition.
The Directional Movement Indicators (DMI) currently is not indicating a specific price direction. Because this is a trend following system, it should not use to initiate any trades right now. The last Directional Movement Indicators (DMI) signal was a BUY 143 day(s) ago.
There were no SAR signals generated today. The last SAR signal was a Sell 3 day(s) ago.
The close is currently
BELOW its 200 daily moving average
BELOW its 50 daily moving average
BELOW its 20 daily moving average
The current market condition for British Pound / US Dollar is Very Bearish
British Pound / US Dollar closed below the lower Bollinger Band by 3.4%. This combined with the steep downtrend suggests that the downward trend in prices has a good chance of continuing. However, a short-term pull-back inside the bands is likely. Bollinger Bands are 22.53% narrower than normal. The current width of the Bollinger Bands (alone) does not suggest anything conclusive about the future volatility or movement of prices.
A black body has formed as prices closed lower than open.
The previous 10 candlestick bars, there are 4 white candles versus 6 black candles with a net of 2 black candles.
The previous 50 candlestick bars, there are 26 white candles versus 24 black candles with a net of 2 white candles.
A engulfing bearish line has formed where a black candle's real body completely contains the previous white candle's real body. The engulfing bearish pattern is bearish during an uptrend. It signifies that the momentum may be shifting from the bulls to the bears.
If the engulfing bearish pattern occurs during a downtrend (which is the case with US Dollar / Japanese Yen), it may be a last engulfing bottom which indicates a bullish reversal. The test to see if this is the case is if the next candle closes above the bottom the current (black) candle's real body.MACD is BEARISH as the MACD is below the signal line.
The MACD crossedbelow the signal line 2 week(s) ago. Since the MACD crossed the MACD moving average, US Dollar / Japanese Yen's price has decreased 0.75%, and has been fluctuating from a high of 123.538 to a low of 120.034.
The MACD is currently not in an Overbought/Oversold range.
There have been no divergencesignals during the last 5 periods.
No Stochastic Buy or Sell signals generated today. The last signal was a Sell 163 Week(s) Ago.
The RSI is not currently in a topping (above 70) or bottoming (below 30) range. A buy or sell signal generated when the RSI moves out of an overbought/oversold area. The last signal was a Sell 28 week(s) ago.
Currently the RSI does not show any Failure Swings. The RSI and price of US Dollar / Japanese Yen are not diverging.
Currently, the Momentum Oscillator does not show an overbought or oversold condition.
The Directional Movement Indicators (DMI) currently is not indicating a specific price direction. Because this is a trend following system, it should not use to initiate any trades right now. The last Directional Movement Indicators (DMI) signal was a SELL 17 week(s) ago.
There were no SAR signals generated today. The lastSAR signal was a Buy 7 week(s) Ago.
The close is currently
ABOVE its 200 weekly moving average
ABOVE its 50 weekly moving average
BELOW its 20 weekly moving average
The current market condition for US Dollar / Japanese Yen is Bullish
US Dollar / Japanese Yen closed above the lower Bollinger Band by 27.8%. Bollinger Bands are 38.38% narrower than normal. The current width of the Bollinger Bands (alone) does not suggest anything conclusive about the future volatility or movement of prices.