Intra Day Trading
Intra Day Trading
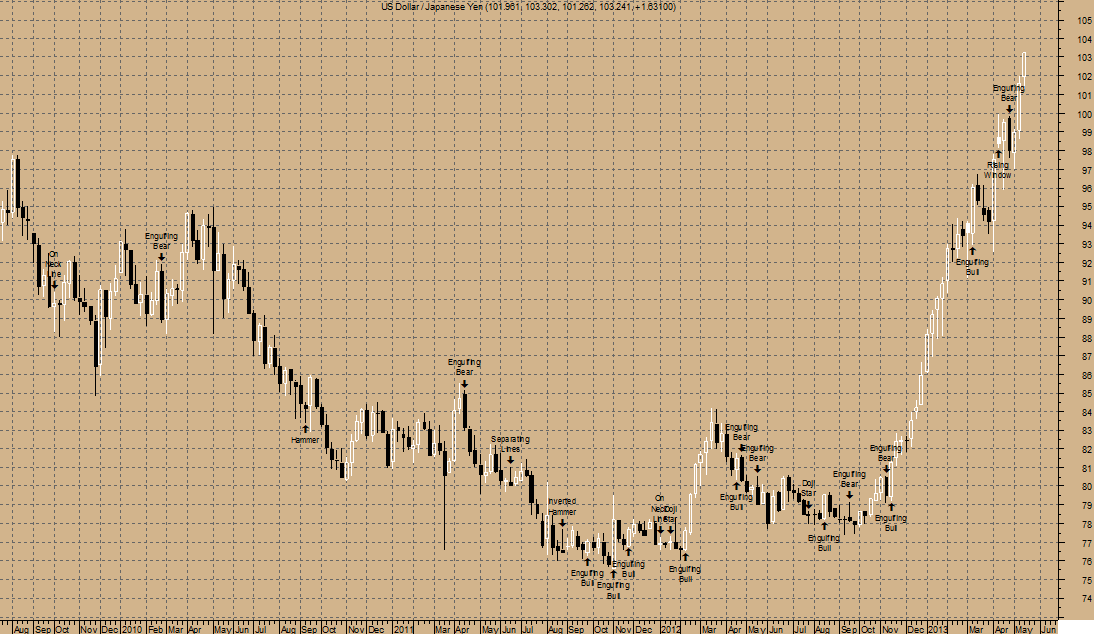
USD/JPY WEEKLY as of Monday, 20 May, 2013
Last Friday USD/JPY closes with a Weekly white body.For the past 10 Weekly candlestick bars, there are 5 white candles versus 5 black candles. For the past 50 Weekly candlestick bars, there are 27 white candles versus 23 black candles with a net of 4 white candles.
Three Weekly white candles has formed during the last three Weekly bars. Although these candles were not big enough to create threeWeekly white soldiers, the steady upward pattern is bullish.
Prices has set a new 14-period high while the RSI has not. This is a BEARISH DIVERGENCE and the Momentum Oscillator is in an overbought condition.
The close is currently
ABOVE its 200 weekly moving average
ABOVE its 50 weekly moving average
ABOVE its 20 weekly moving average
The current market condition for US Dollar / Japanese Yen is Very Bullish
On 17/05/2013, US Dollar / Japanese Yen closed above the upper Bollinger Band by 1.4%. This combined with the steep uptrend suggests that the upward trend in prices has a good chance of continuing. However, a short-term pull-back inside the Bollinger Bands is likely. Bollinger Bands are 106.32% wider than normal. The large width of the Bollinger Bands suggest high volatility as compared to US Dollar / Japanese Yen's normal range. Therefore, the probability of volatility decreasing and prices entering (or remaining in) a trading range has increased for the near-term. The Bollinger bands have been in this wide range for 20 weeks. The probability of prices consolidating into a less volatile trading range increases the longer the Bollinger Bands remain in this wide range.
The present wave patterns are:
fast amplitude (8%): bullish wave C
moderate amplitude (13%): bullish wave 1
US Dollar / Japanese Yen is long term Bullish as the 144 days moving average of 86.02 is increasing. The Relative Strength Index is at 83.12 in the overbought territory. The Relative Momentum Index is at 95.71 in the overbought territory. An important indicator for Elliott waves, the Elliott oscillator is at 9.12, in positive territory; this is a bullish sign. An equally important indicator, the STORSI is at 36.67. This value is in the neutral territory.
All wave counts are based on the high low price in this commentary!
*** Intra-Daily Trading Strategy: BUY USD/JPY
Buy Target: 103.6347
Buy Stop: 101.7263
Enter BUY on OPEN and exit BUY at Target price or at Stop price.Do not reverse.
This is a recommendation for INTRA-DAY TRADING only!!!!
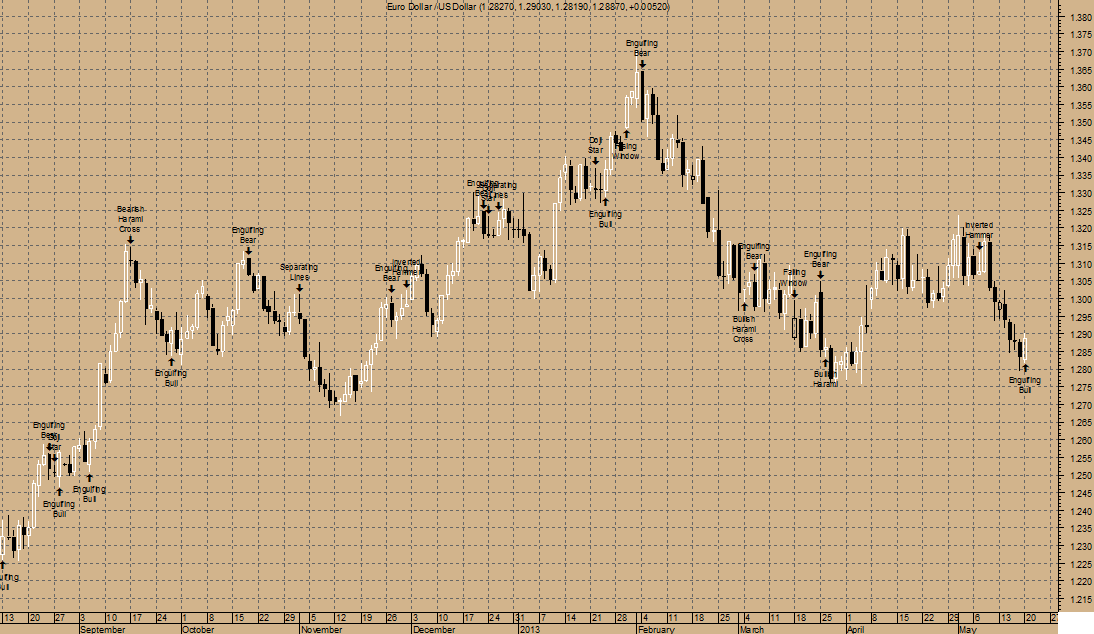
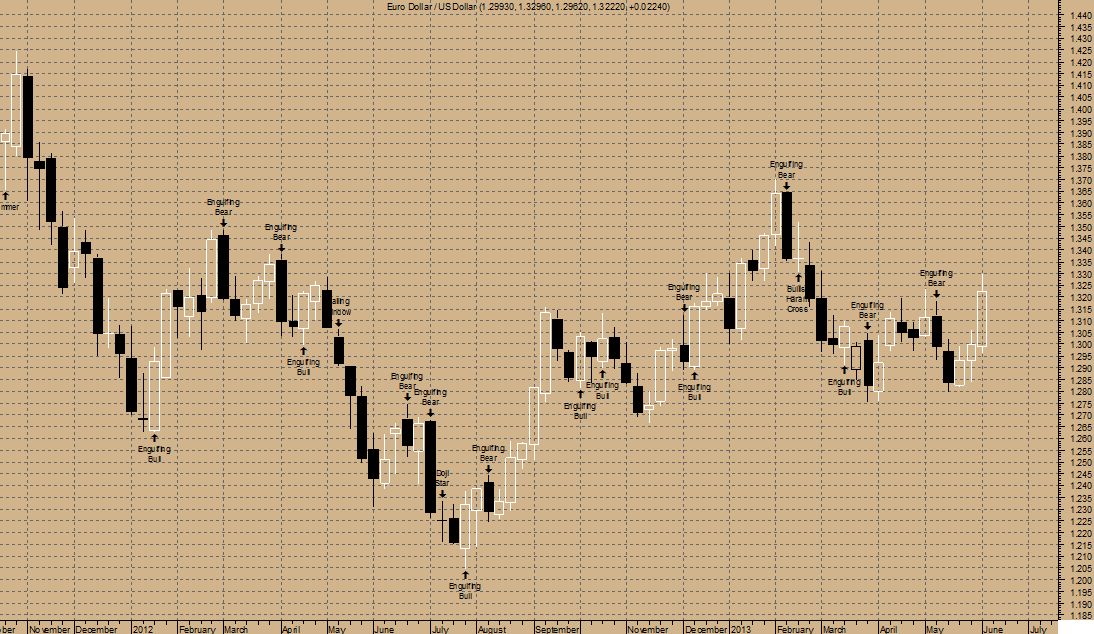
EUR/USD DAILYas ofTuesday, 21 May, 2013
Euro Dollar / US Dollar appears to be locked in a trading range bounded by upside resistance and downside support. The most recently confirmed upside resistance level for Euro Dollar / US Dollar is around 1.32. Expect prices to have some difficulty rising above this level. A break above this level would be a bullish sign. The most recently confirmed downside support level for Euro Dollar / US Dollar is around 1.27. Expect prices to have some difficulty falling below this level. A break below this level would be a bearish sign.
A Daily white body has formed during yesterday’s trading seesion.For the past 10 Daily candlestick bars as of 20/05/2013, there are 5 white candles versus 5 black candles. For the past 50 Daily candlestick bars as of 20/05/2013, there are 27 white candles versus 23 black candles with a net of 4 white candles.
A Daily engulfing bullish line has formed (where a white candle's real body completely contains the previous black candle's real body). The engulfing bullish pattern is bullish during a downtrend(which appears to be the case with Euro Dollar / US Dollar). It then signifies that the momentum may be shifting from the bears to the bulls.
If the engulfing bullish pattern occurs during an uptrend, it may be a last engulfing top which indicates a top. The test to see if this is the case is if the next candle closes below the top of the current (white) candle's real body.
Directional Movement Indicators (DMI) signal was a SELL 2 days ago and SAR signal was a Sell 8 days ago.
The close is currently
BELOW its 200 daily moving average
BELOW its 50 daily moving average
BELOW its 20 daily moving average
The current market condition for Euro Dollar / US Dollar is Very Bearish
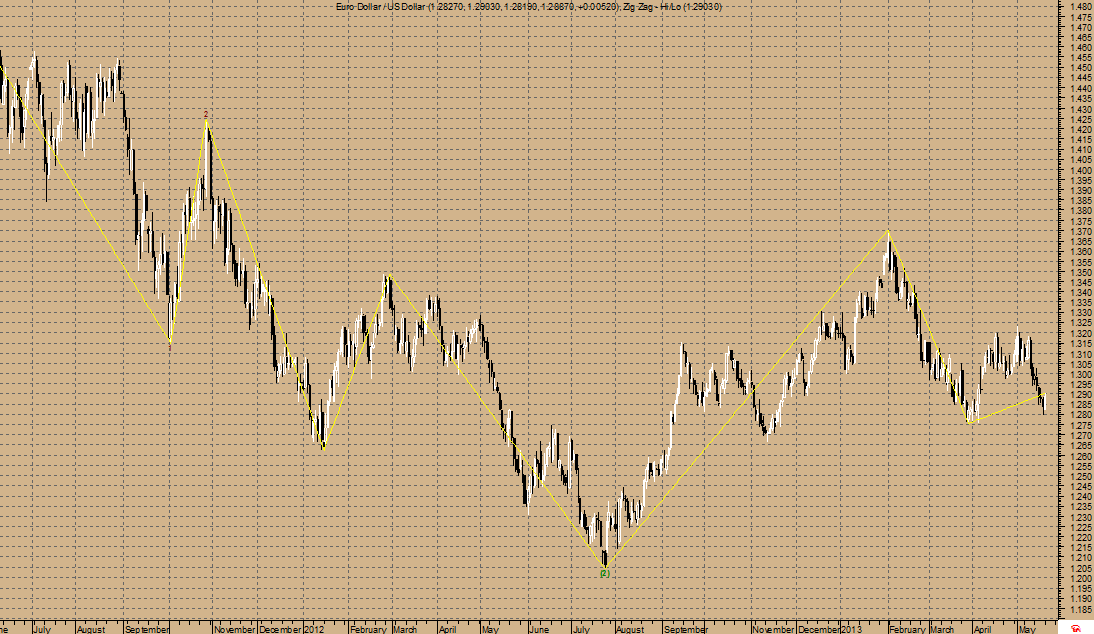
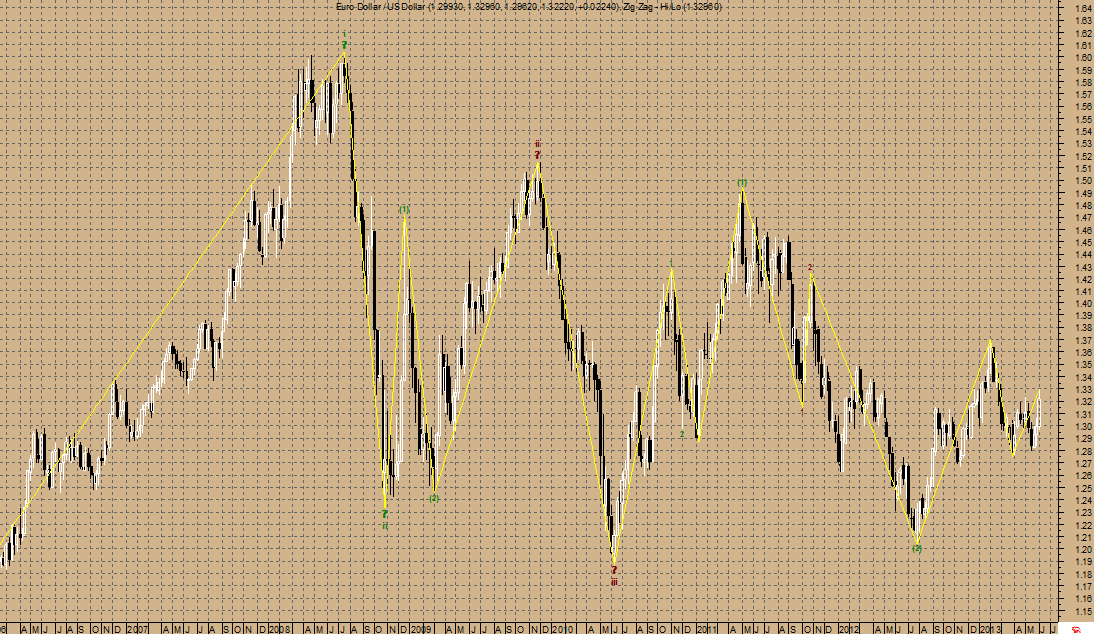
Elliott Waves High Volatility has detected a possible point 4 of a WolfWave (21%) pattern for Euro Dollar / US Dollar. This pattern is an expanding triangle and trades from the next point. When the peak or trough will form, usually after crossing or touching the extended line of points 1 and 3, the price will move in the opposite direction towards the target line formed by the extension of points 2 and 4.
The present wave patterns are:
fast amplitude (8%): bullish wave 1
moderate amplitude (13%): bullish wave 3
Elliott Waves High Volatility has detected an Isolated Low at 1.28one bar ago ; this is usually a bullish sign
All wave counts are based on the high low price in this commentary!
Euro Dollar / US Dollar is long term Bearish as the 144 days moving average of 1.30 is decreasing. The Relative Strength Index is at 41.21 in the neutral territory. The Relative Momentum Index is at 31.84 in the neutral territory. An important indicator for Elliott waves, the Elliott oscillator is at -0.01, in negative territory; this is a bearish sign. An equally important indicator, the STORSI is at 9.21. This value is in the oversold territory.
On 20/05/2013, Euro Dollar / US Dollar closed above the lower Bollinger Band by 15.7%. Bollinger Bands are 9.27% narrower than normal.
*** Intra-Daily Trading Strategy: BUY
Buy Target: 1.2920
Buy Stop: 1.2786
Enter BUY on OPEN and exit BUY at Target price or at Stop price.Do not reverse.
This is a recommendation for INTRA-DAY TRADING 0nly!!!!
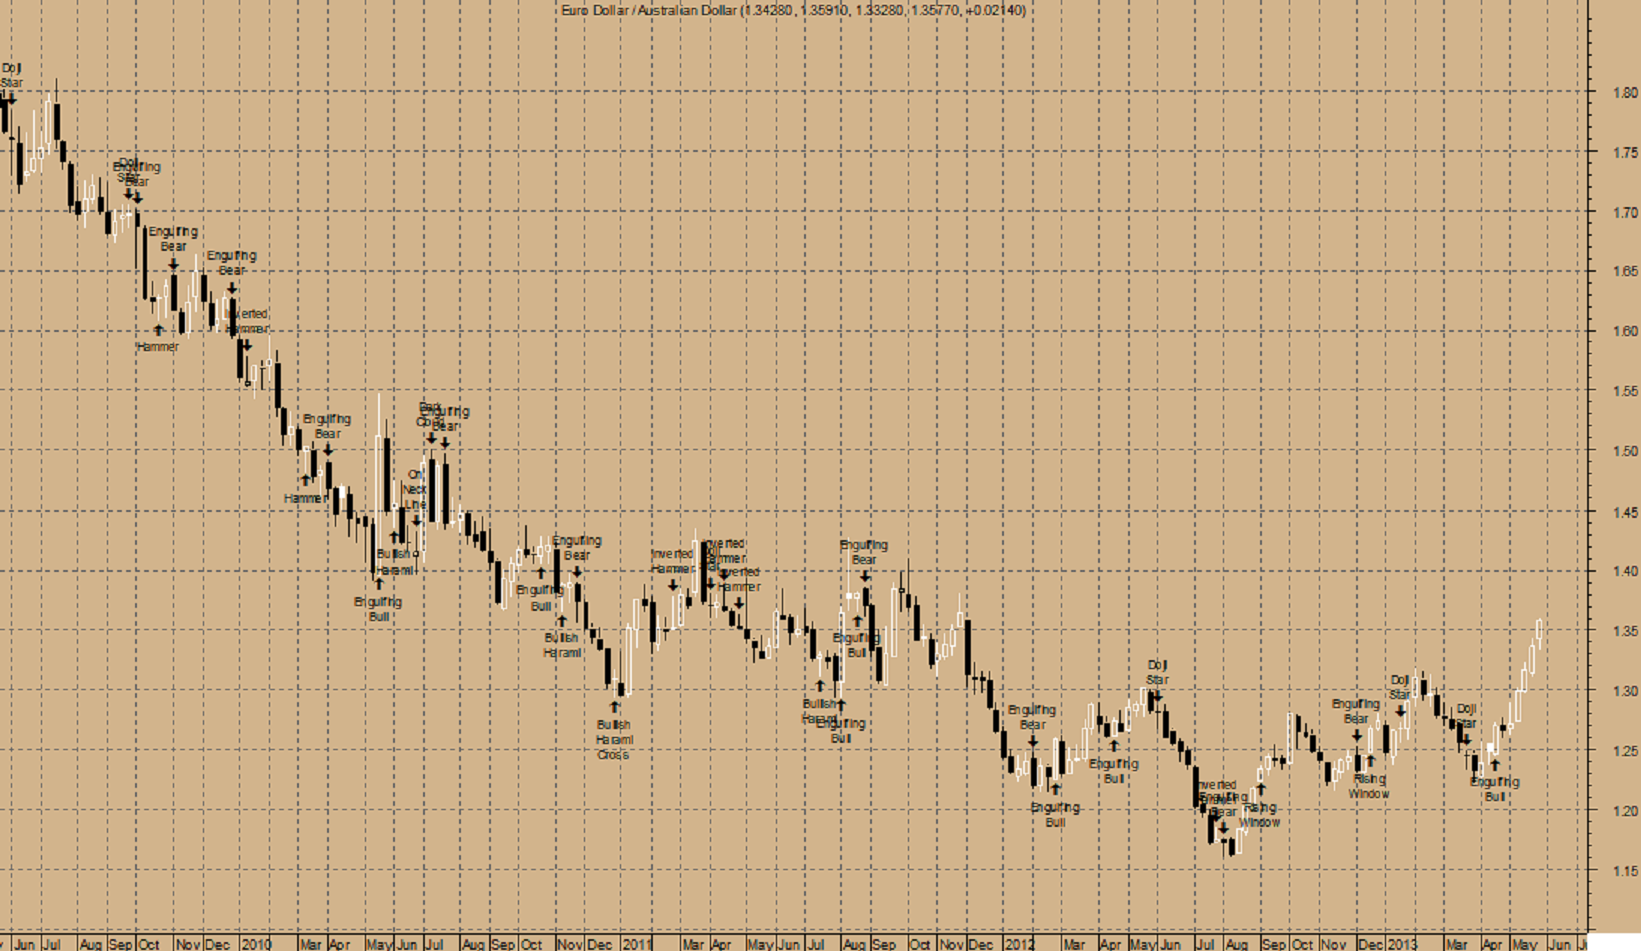
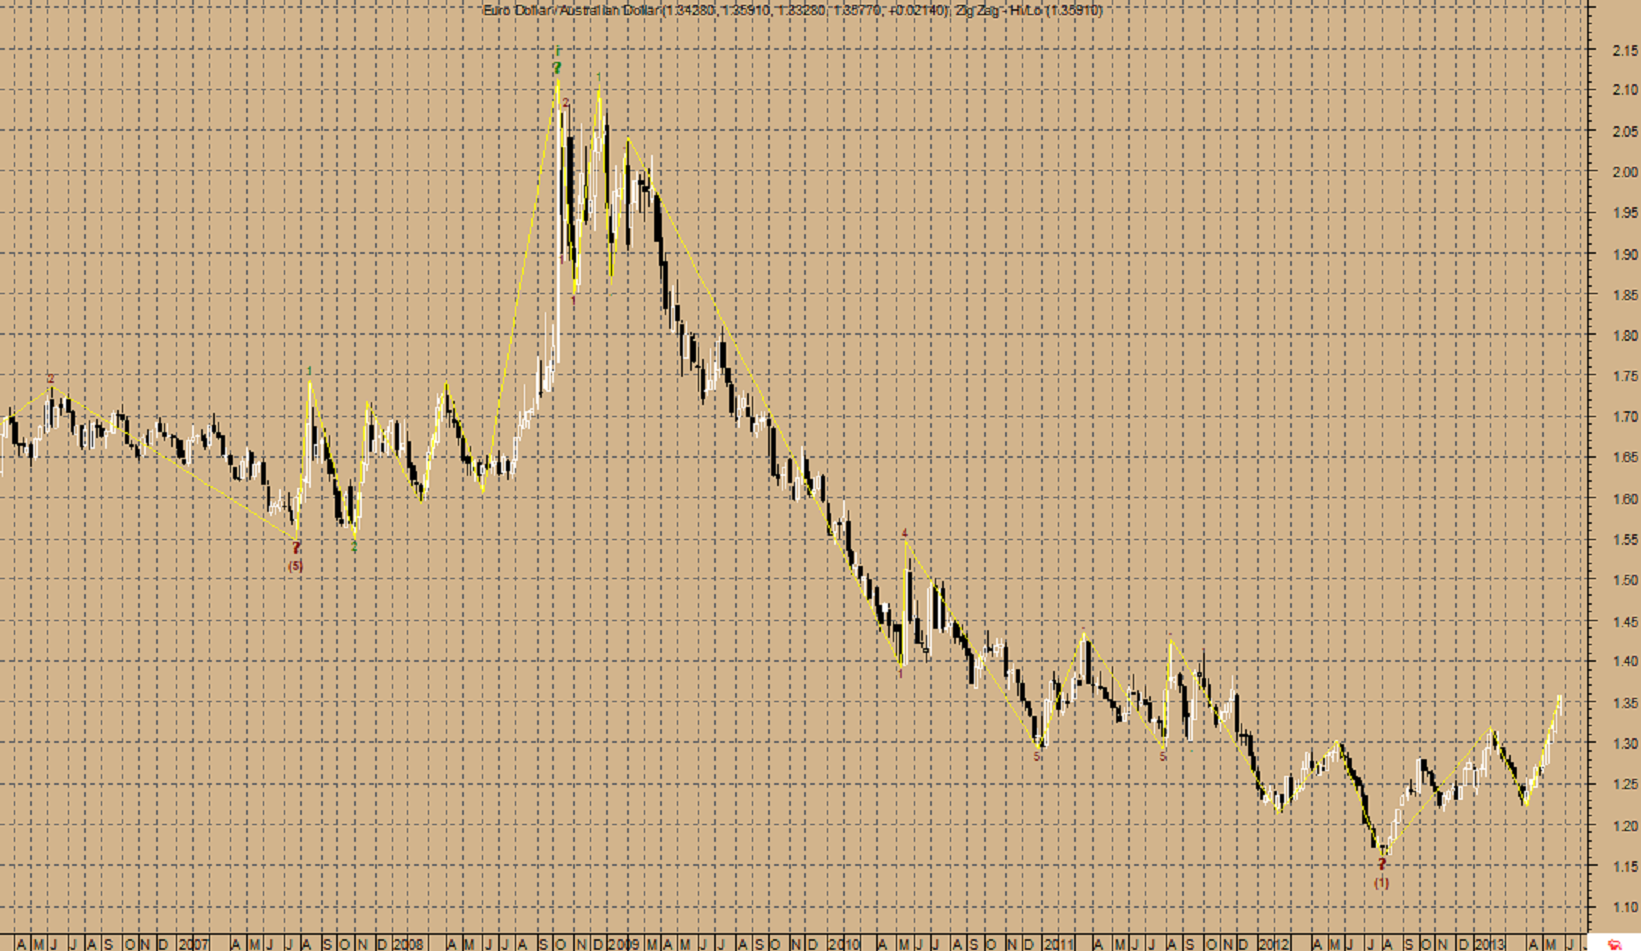
EUR/AUD WEEKLY as of Monday, 03 June, 2013
Euro Dollar / Australian Dollar broke above the upside resistance level of 1.23, nine weeks ago which signals a bullish sign. This previous resistance level of 1.23 may now provide downside support. Prices have risen some distance since breaking out--9.29%, thereby adding more validity to the breakout.
A Weekly white body has formed during last week’s trading. Three Weekly white candles has formed during the last three Weekly bars. Although these candles were not big enough to create threeWeekly white soldiers, the steady upward pattern is bullish.
Having reach a Weekly bottom 8 weeks ago at 1.2219, prices are currently moving upwards
TARGET 1: 1.2733 (Moderate Retracement)
TARGET 2: 1.3050 (Extension)
TARGET 3: 1.3564 (Extension)
TARGET 4: 1.388 (Expansion)
TARGET 5: 1.4395 (Expansion)
Projected Time:6 weeks (Moderate Retracement)
Projected Time:10 6 weeks (Extension)
Projected Time:16 6 weeks (Extension)
Projected Time:20 6 weeks (Expansion)
Projected Time:26 6 weeks (Expansion)
MACD is currently BULLISH and the MACD is above the signal line. The MACD crossed above the signal line 3 weeks ago. Since the MACD crossed the MACD moving average, Euro Dollar / Australian Dollar's price has increased 4.49%, and has fluctuate from a high of 1.359 to a low of 1.274.
RSI has just reached its highest value in the last 14 weeks which signals a BULLISHsignal.
SAR signal was a Buy 3 weeks ago.
The close is currently
BELOW its 200 weekly moving average
ABOVE its 50 weekly moving average
ABOVE its 20 weekly moving average
The current market condition for Euro Dollar / Australian Dollar is Mildly Bearish
On 31/05/2013, Euro Dollar / Australian Dollar closed above the upper Bollinger Band by 10.4%. This combined with the steep uptrend suggests that the upward trend in prices has a good chance of continuing. However, a short-term pull-back inside the Bollinger Bands is likely. Bollinger Bands are 3.81% narrower than normal. The current width of the Bollinger Bands (alone) does not suggest anything conclusive about the future volatility or movement of prices.
The present wave patterns are:
fast amplitude (8%): bullish wave 1
Elliott Waves High Volatility has detected a Gann Swing or Pullback that is usually a bullish pattern!
Please note that all wave counts are based on the high low price in this commentary!
Euro Dollar / Australian Dollar is long term Bearish as the 144 days moving average of 1.33 is decreasing. The Relative Strength Index is at 71.90 in the overbought territory. The Relative Momentum Index is at 67.36 in the neutral territory. An important indicator for Elliott waves, the Elliott oscillator is at 0.05, in positive territory; this is a bullish sign. An equally important indicator, the STORSI is at 100.00. This value is in the overbought territory.
*** Intra-Daily Trading Strategy: BUYEURAUD
Buy Target: 1.3619
Buy Stop: 1.3436
Enter New BUY on OPEN and exit BUY positions at Target price or at Stop price.Do not reverse after exiting as Trending & Anti-Trending mode are being used by this system.
This is a recommendation for INTRA-DAY TRADING only!!!!!
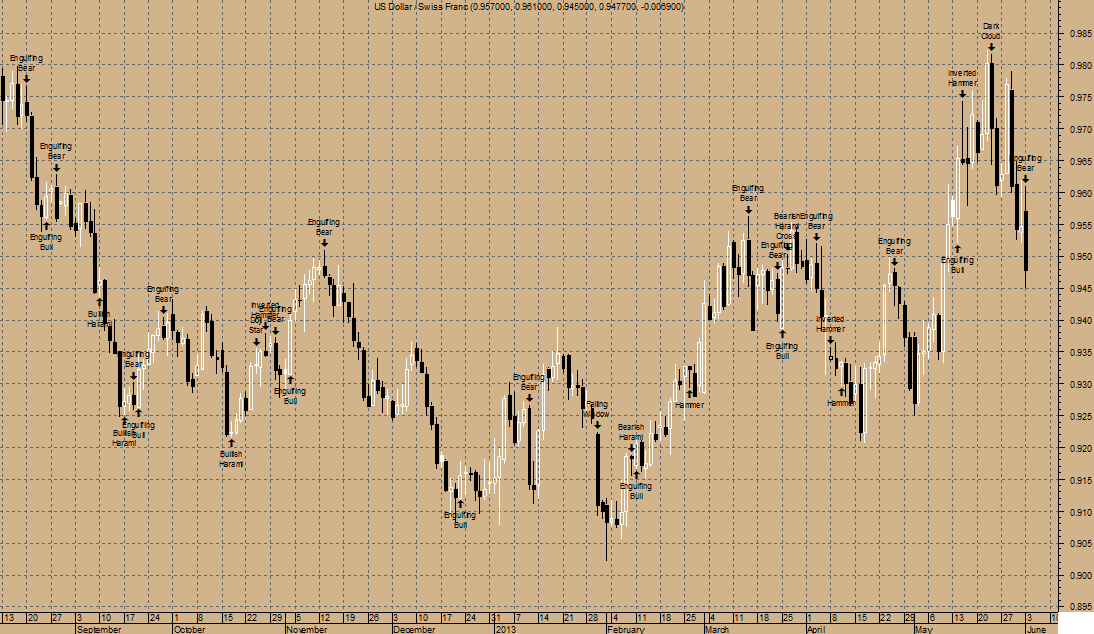
USD/CHF DAILY as of Tuesday, 04 June, 2013. A Daily black body has formed been formed yesterday.
A Daily engulfing bearish line has formed (where a black candle's real body completely contains the previous white candle's real body). The engulfing bearish pattern is bearish during an uptrend. It signifies that the momentum may be shifting from the bulls to the bears.
If the engulfing bearish pattern occurs during a downtrend (which appears to be the case with US Dollar / Swiss Franc), it may be a last engulfing bottom which indicates a bullish reversal. The test to see if this is the case is if the next candle closes above the bottom the current (black) candle's real body.
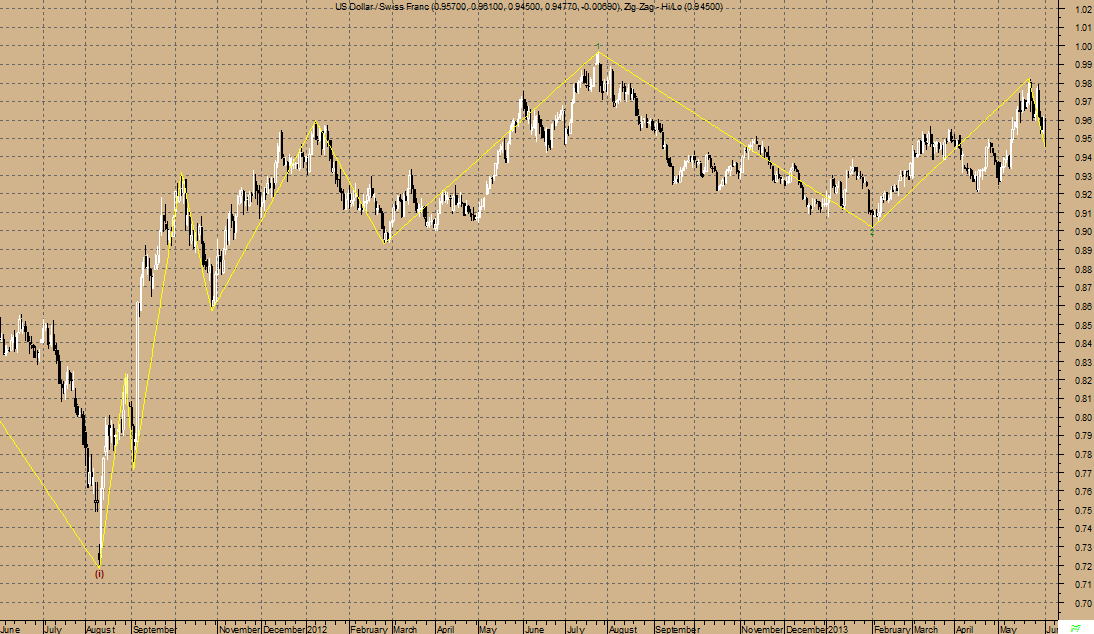
Having reached a Daily top 8 period(s) ago at 0.9823, prices are currently moving downwards.
TARGET 1: 0.9629 (Moderate Retracement)
TARGET 2: 0.9509 (Extension)
TARGET 3: 0.9315 (Extension)
TARGET 4: 0.9195 (Expansion)
TARGET 5: 0.9001 (Expansion)
Projected Time:10 days (Moderate Retracement)
Projected Time:16 days (Extension)
Projected Time:26 days (Extension)
Projected Time:32 days (Expansion)
Projected Time:42 days (Expansion)
The MACD is currently BEARISH. The MACD is currently below the signal line as the MACD crossed below the signal line 4 days ago. Since the MACD crossed the MACD moving average, US Dollar / Swiss Franc's price has decreased 1.37%, and has fluctuate from a high of 0.979 to a low of 0.945.
The last signal for RSI was a Sell 8 days ago and RSI has just reached its lowest value in the last 14 days. This is BEARISH signal for USD/CHF
SAR signal was a Sell 3 days ago.
The close is currently
ABOVE its 200 daily moving average
BELOW its 50 daily moving average
BELOW its 20 daily moving average
The current market condition for US Dollar / Swiss Franc is Mildly Bullish
On 03/06/2013, US Dollar / Swiss Franc closed above the lower Bollinger Band by 21.8%. Bollinger Bands are 44.73% wider than normal. The large width of the Bollinger Bands suggest high volatility as compared to US Dollar / Swiss Franc's normal range. Therefore, the probability of volatility decreasing and prices entering (or remaining in) a trading range has increased for the near-term. The Bollinger bands have been in this wide range for 15 days. The probability of prices consolidating into a less volatile trading range increases the longer the Bollinger Bands remain in this wide range.
Warning! Elliott Waves High Volatility has detected a possible point 4 of a WolfWave (21%) pattern for US Dollar / Swiss Franc. This pattern is an expanding triangle and trades from the next point. When the peak or trough will form, usually after crossing or touching the extended line of points 1 and 3, the price will move in the opposite direction towards the target line formed by the extension of points 2 and 4.
The present wave patterns are:
fast amplitude (8%): bullish wave 3
moderate amplitude (13%): bullish wave 1
normal amplitude (21%): bullish wave 1
Elliott Waves High Volatility has detected a Gann Swing or Pullback that is usually a bearish pattern!
Please note that all wave counts are based on the high low price in this commentary!
US Dollar / Swiss Franc is long term Bullish as the 144 days moving average of 0.94 is increasing. The Relative Strength Index is at 45.13 in the neutral territory. The Relative Momentum Index is at 57.40 in the neutral territory. An important indicator for Elliott waves, the Elliott oscillator is at 0.00, in positive territory; this is a bullish sign. An equally important indicator, the STORSI is at 0.43. This value is in the oversold territory.
*** Intra-Daily Trading Strategy: SELLUSDCHF
Sell Target:0.9415
Sell Stop: 0.9672
Enter New SELL on OPEN and exit SELL positions at Target price or at Stop price.Do not reverse after exiting as Trending & Anti-Trending mode are being used by this system.
This is a recommendation for INTRA-DAY TRADING only!!!!!
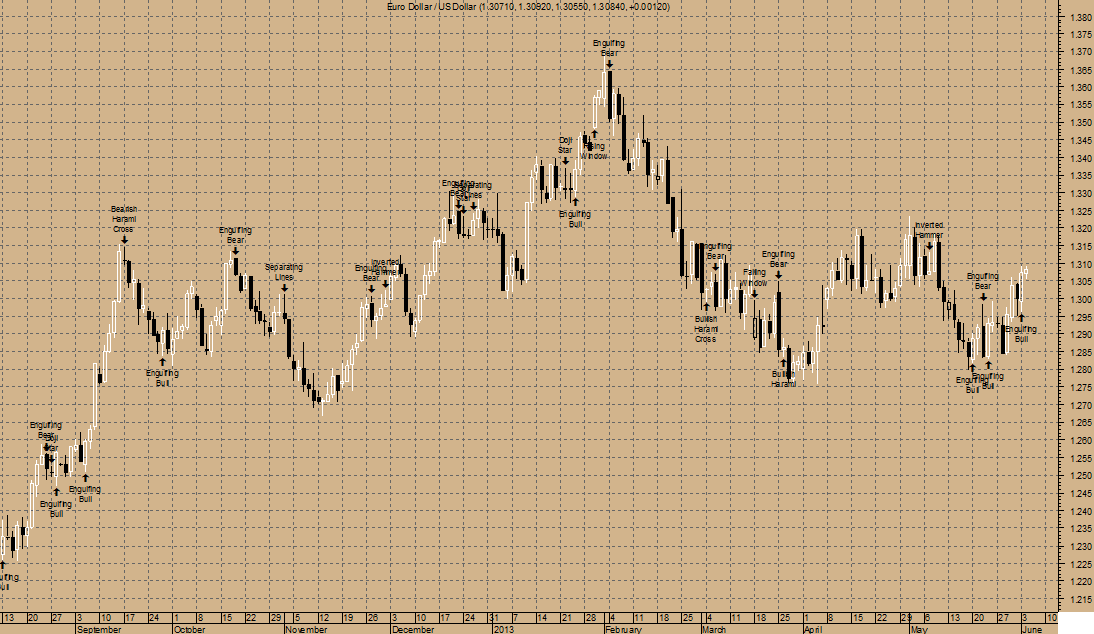
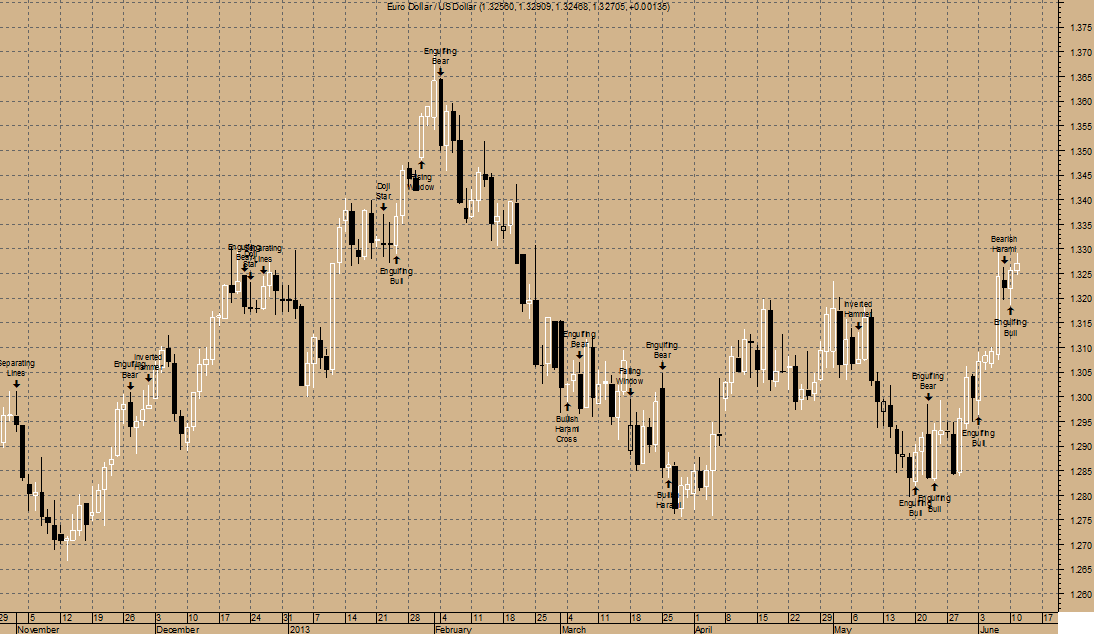
EUR/USD DAILYas ofWednesday, 05 June, 2013
Euro Dollar / US Dollar broke above the down trendline at 1.31, 2 days ago and this is a bullish sign. This down trendline, currently with an ending point at 1.31, may now provide downside support.
A Daily white body has formed yesterday. And a Daily spinning top has formed (a spinning top is a candle with a small real body). Spinning tops identify a session in which there is little price action as defined by the difference between the open and the close. During a rally or near new highs, a spinning top can be a sign that prices are losing momentum and the bulls may be in trouble.
The MACD is BULLISH. The MACD is currently above the signal line. Since MACD moved above the signal line 4 days ago, Euro Dollar / US Dollar's price has increased 0.35%, and has fluctuate from a high of 1.309 to a low of 1.293.
RSI has just reached its highest value in the last 14 days. This is BULLISHsignal and also the Directional Movement Indicators (DMI) andSAR signal a BUY 5 days ago.
The close is currently
ABOVE its 200 daily moving average
ABOVE its 50 daily moving average
ABOVE its 20 daily moving average
The current market condition for Euro Dollar / US Dollar is Very Bullish
On 04/06/2013, Euro Dollar / US Dollar closed below the upper Bollinger Band by 13.2%. Bollinger Bands are 19.59% narrower than normal.
Elliott Waves High Volatility has detected a possible point 4 of a WolfWave (21%) pattern for Euro Dollar / US Dollar. This pattern is an expanding triangle and trades from the next point. When the peak or trough will form, usually after crossing or touching the extended line of points 1 and 3, the price will move in the opposite direction towards the target line formed by the extension of points 2 and 4.
The present wave patterns are:
fast amplitude (8%): bullish wave 1
moderate amplitude (13%): bullish wave 3
Elliott Waves High Volatility has detected a Gann Swing or Pullback that is usually a bullish pattern!
Please note that all wave counts are based on the high low price in this commentary!
Euro Dollar / US Dollar is long term Bearish as the 144 days moving average of 1.30 is decreasing. The Relative Strength Index is at 57.30 in the neutral territory. The Relative Momentum Index is at 55.46 in the neutral territory. An important indicator for Elliott waves, the Elliott oscillator is at 0.00, in positive territory; this is a bullish sign. An equally important indicator, the STORSI is at 94.16. This value is in the overbought territory.
*** Intra-Daily Trading Strategy: SELLEURUSD
Sell Target:1.3062
Sell Stop: 1.3114
Enter New SELL on OPEN and exit SELL positions at Target price or at Stop price.Do not reverse after exiting as Trending & Anti-Trending mode are being used by this system.
This is a recommendation for INTRA-DAY TRADING only!!!!!
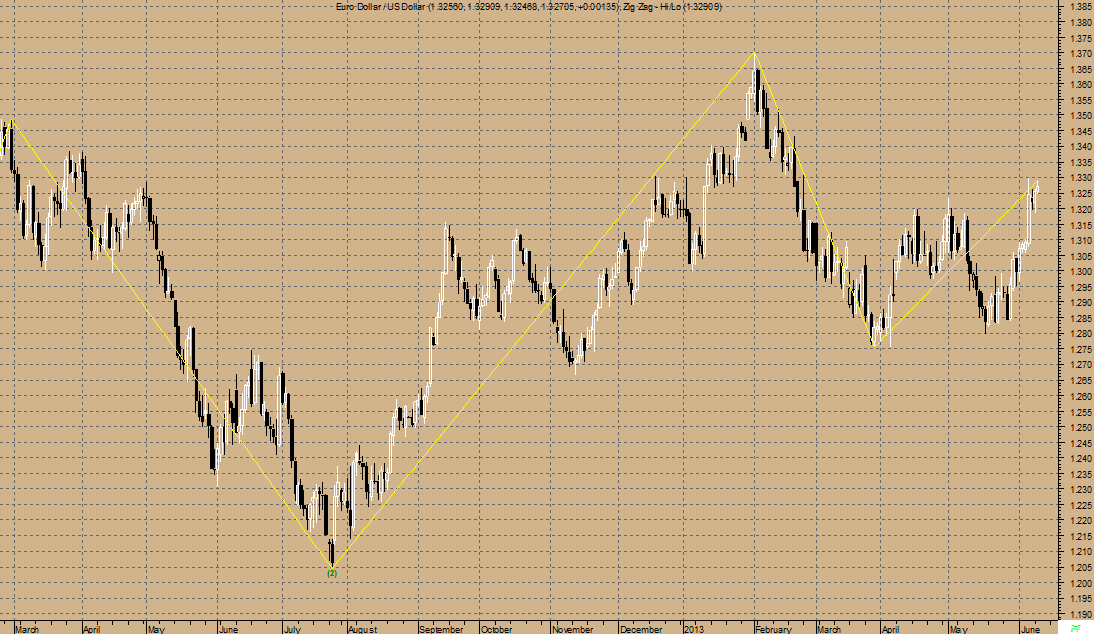
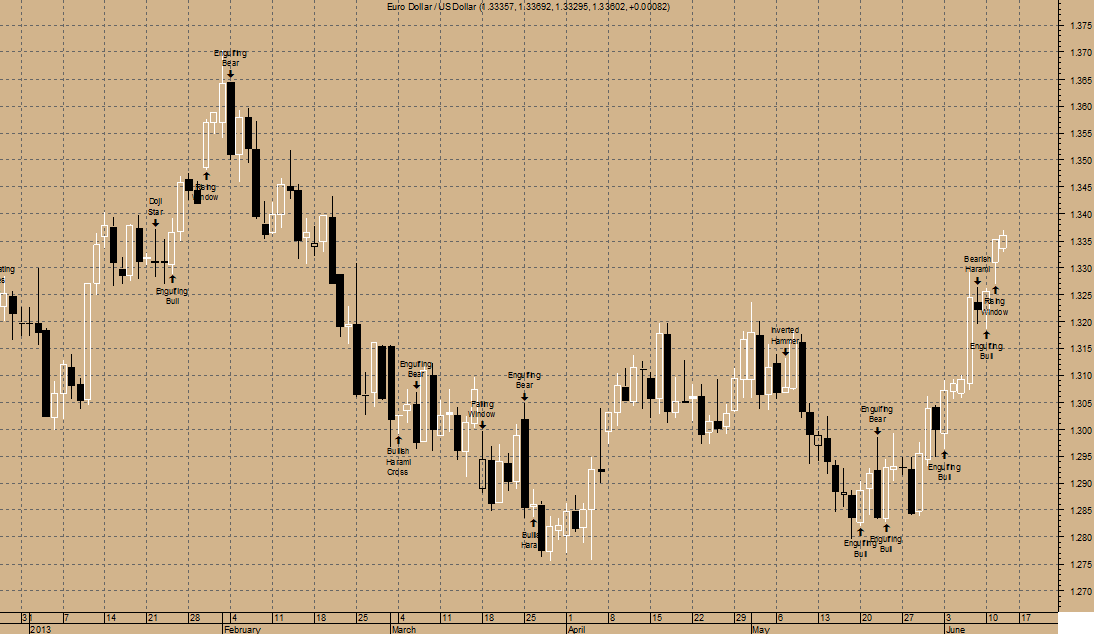
EUR/USD WEEKLY as of Monday, 10 June, 2013
Euro Dollar / US Dollar appears to be locked in a trading range bounded by upside resistance and downside support. The most recently confirmed upside resistance level for Euro Dollar / US Dollar is around 1.49 and with the most recently confirmed downside support level for Euro Dollar / US Dollar is around 1.21
A Weekly big white candle has formed. This is a bullish candle as prices closed significantly higher than they opened. If the candle appears when prices are "low," it may be the first sign of a bottom. If it occurs when prices are rebounding off a support area (e.g., a moving average, trend line, or retracement level), the long white candle adds credibility to the support. Similarly, if the candle appears during a breakout above a resistance area, the long white candle adds credibility to the breakout. Three Weekly white candles has formed during the last three Weekly bars. Although these candles were not big enough to create threeWeekly white soldiers, the steady upward pattern is bullish.
MACD is currently BEARISH. The MACD is currently below the signal line. The MACD crossed below the signal line 14 weeks ago. Since the MACD crossed the MACD moving average, Euro Dollar / US Dollar's price has increased 1.57%, and has fluctuate from a high of 1.331 to a low of 1.276.
RSI has just reached its highest value in the last 14 weeks. This is BULLISHsignal.
The ADX is currently below both Plus and Minus Directional indicators. The Directional Movement Indicators (DMI) currently is not indicating a specific price direction.
SAR signal was a Buy 5 weks Ago.
The close is currently
BELOW its 200 weekly moving average
ABOVE its 50 weekly moving average
ABOVE its 20 weekly moving average
The current market condition for Euro Dollar / US Dollar is Mildly Bearish
Euro Dollar / US Dollar closed below the upper Bollinger Band by 36.0%. Bollinger Bands are 39.38% narrower than normal. The current width of the Bollinger Bands (alone) does not suggest anything conclusive about the future volatility or movement of prices.
Elliott Waves High Volatility has detected a possible point 4 of a WolfWave (21%) pattern for Euro Dollar / US Dollar. This pattern is an expanding triangle and trades from the next point. When the peak or trough will form, usually after crossing or touching the extended line of points 1 and 3, the price will move in the opposite direction towards the target line formed by the extension of points 2 and 4.
The present wave patterns are:
fast amplitude (8%): bullish wave 1
moderate amplitude (13%): bullish wave 3
Elliott Waves High Volatility has detected a Gann Swing or Pullback that is usually a bullish pattern
Please note that all wave counts are based on the high low price in this commentary!
Euro Dollar / US Dollar is long term Bearish as the 144 days moving average of 1.32 is decreasing. The Relative Strength Index is at 55.80 in the neutral territory. The Relative Momentum Index is at 47.76 in the neutral territory. An important indicator for Elliott waves, the Elliott oscillator is at 0.01, in positive territory; this is a bullish sign. An equally important indicator, the STORSI is at 76.78. This value is in the overbought territory.
EUR/USD DAILYas ofTuesday, 11 June, 2013
A Daily white body has formed (because prices closed higher than they opened).
A Daily spinning top has formed (a spinning top is a candle with a small real body). Spinning tops identify a session in which there is little price action as defined by the difference between the open and the close. During a rally or near new highs, a spinning top can be a sign that prices are losing momentum and the bulls may be in trouble.
Euro Dollar / US Dollar broke above the upside resistance level of 1.32, four days ago which signals a bullish sign. This previous resistance level of 1.32 may now provide downside support.
MACD is currently BULLISH. The MACD is currently above the signal line. The MACD crossed above the signal line 9 days ago. Since the MACD crossed the MACD moving average, Euro Dollar / US Dollar's price has increased 1.78%, and has fluctuate from a high of 1.330 to a low of 1.293.
RSI has just reached its highest value in the last 14 days. This is BULLISHsignal and the Momentum Oscillator is in an overbought condition with the Directional Movement Indicators (DMI) signaling a BUY 10 days ago and SAR signal was also a Buy 10 days ago.
The close is currently
ABOVE its 200 daily moving average
ABOVE its 50 daily moving average
ABOVE its 20 daily moving average
The current market condition for Euro Dollar / US Dollar is Very Bullish
Euro Dollar / US Dollar closed below the upper Bollinger Band by 3.8%. Bollinger Bands are 33.14% wider than normal. The current width of the Bollinger Bands (alone) does not suggest anything conclusive about the future volatility or movement of prices.
Elliott Waves High Volatility has detected a possible point 4 of a WolfWave (21%) pattern for Euro Dollar / US Dollar. This pattern is an expanding triangle and trades from the next point. When the peak or trough will form, usually after crossing or touching the extended line of points 1 and 3, the price will move in the opposite direction towards the target line formed by the extension of points 2 and 4. An Inside Day Narrow Range was detected by your Elliott Waves High Volatility on 11/06/2013. This is usually a trade set-up opportunity.
The present wave patterns are:
Please note that all wave counts are based on the high low price in this commentary!
fast amplitude (8%): bullish wave 1
moderate amplitude (13%): bullish wave 3
Elliott Waves High Volatility has detected an Isolated Low at 1.32one bar ago ; this is usually a bullish
Euro Dollar / US Dollar is long term Bullish as the 144 days moving average of 1.30 is increasing. The Relative Strength Index is at 66.34 in the neutral territory. The Relative Momentum Index is at 71.07 in the overbought territory. An important indicator for Elliott waves, the Elliott oscillator is at 0.02, in positive territory; this is a bullish sign. An equally important indicator, the STORSI is at 95.78. This value is in the overbought territory.
*** Intra-Daily Trading Strategy: BUYEURUSD
Buy Target: 1.3292
Buy Stop: 1.3225
Enter New BUY on OPEN and exit BUY positions at Target price or at Stop price.
(PLEASE TAKE NOTE: If necessary, adjust the Stop Loss Price according to your trading risk.)
Do not reverse after exiting as Trending & Anti-Trending mode are being used by this system.
This is a recommendation for INTRA-DAY TRADING only!!!!!
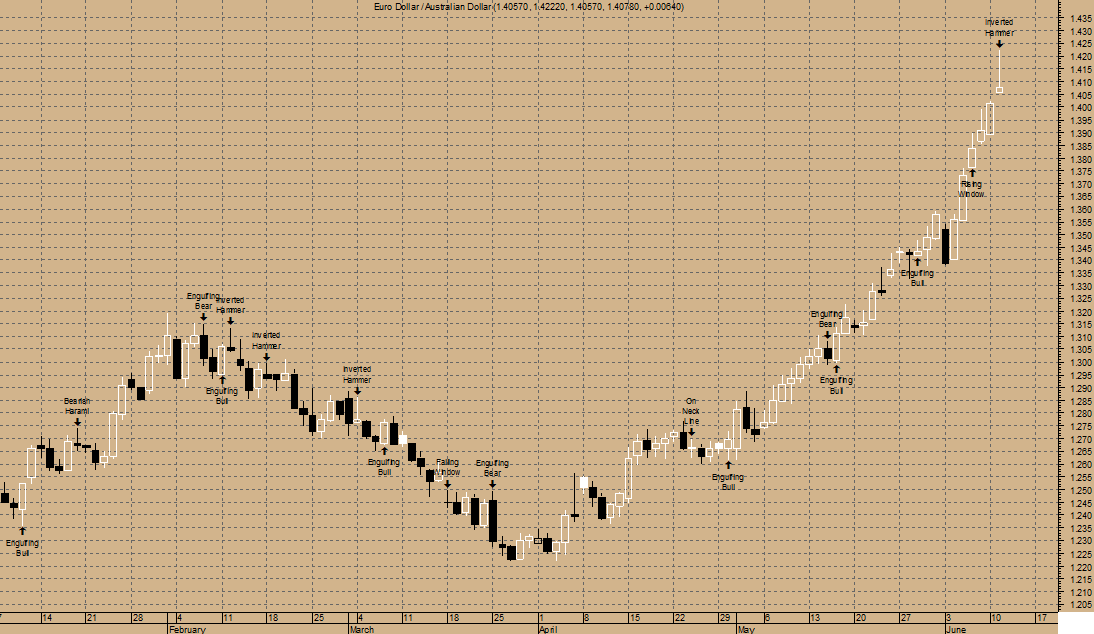
EUR/AUD DAILY as of Wednesday, 12 June, 2013
The most recently confirmed up trendline for Euro Dollar / Australian Dollar has an ending point currently at 1.22. Expect prices to have some difficulty falling below this trendline. A break below this trendline on heavy trading would be a bearish sign.
A Daily white body has formed (because prices closed higher than they opened).
For the past 10 Daily candlestick bars as of 11/06/2013, there are 9 white candles versus 1 black candles with a net of 8 white candles.
For the past 50 Daily candlestick bars as of 11/06/2013, there are 35 white candles versus 15 black candles with a net of 20 white candles.
A Daily inverted hammer has formed. If this occurs during a downtrend it implies a reversal. Look for a confirmation of the reversal on the bar.A Daily long upper shadow has formed. This is typically a bearish signal (particularly when it occurs near a high price level, at resistance level, or when the security is overbought).A Daily rising window has formed (where the top of the previous shadow is below the bottom of the current shadow). This usually implies a continuation of a bullish trend.A Daily shooting star has formed (a shooting star has a small real body near the bottom of the candle and a long upper shadow). During an uptrend(which appears to be the case with Euro Dollar / Australian Dollar) the long upper shadow indicates that the bears are gaining control and a top may occur.A Daily spinning top has formed (a spinning top is a candle with a small real body). Spinning tops identify a session in which there is little price action as defined by the difference between the open and the close. During a rally or near new highs, a spinning top can be a sign that prices are losing momentum and the bulls may be in trouble.Three Daily white candles has formed during the last three Daily bars. Although these candles were not big enough to create threeDaily white soldiers, the steady upward pattern is bullish.
MACD is currently BULLISH. The MACD is currently above the signal line. The MACD crossed above the signal line 49 days ago. Since the MACD crossed the MACD moving average, Euro Dollar / Australian Dollar's price has increased 13.55%, and has fluctuate from a high of 1.422 to a low of 1.224.
RSI last signal was a Sell 7 days ago and prices has set a new 14-period high while the RSI has not. This is a BEARISH DIVERGENCEandMomentum Oscillator is in an overbought condition
The close is currently
ABOVE its 200 daily moving average
ABOVE its 50 daily moving average
ABOVE its 20 daily moving average
The current market condition for Euro Dollar / Australian Dollar is Very Bullish
Euro Dollar / Australian Dollar closed above the upper Bollinger Band by 0.5%. This combined with the steep uptrend suggests that the upward trend in prices has a good chance of continuing. However, a short-term pull-back inside the Bollinger Bands is likely. Bollinger Bands are 127.06% wider than normal. The large width of the Bollinger Bands suggest high volatility as compared to Euro Dollar / Australian Dollar's normal range. Therefore, the probability of volatility decreasing and prices entering (or remaining in) a trading range has increased for the near-term. The Bollinger bands have been in this wide range for 17 period(s). The probability of prices consolidating into a less volatile trading range increases the longer the Bollinger Bands remain in this wide range.
*** Intra-Daily Trading Strategy: SELLEURAUD
Sell Target:1.4016
Sell Stop: 1.4327
Enter New SELL on OPEN and exit SELL positions at Target price or at Stop price.
(PLEASE TAKE NOTE: If necessary, adjust the Stop Loss Price according to your trading risk.)
Do not reverse after exiting as Trending & Anti-Trending mode are being used by this system.
This is a recommendation for INTRA-DAY TRADING only!!!!!
EUR/USD DAILYas ofThursday, 13 June, 2013
A Daily white body has formed (because prices closed higher than they opened).
For the past 10 Daily candlestick bars there are 8 white candles versus 2 black candles with a net of 6 white candles.
For the past 50 Daily candlestick bars there are 29 white candles versus 21 black candles with a net of 8 white candles.
Three Daily white candles has formed during the last three Daily bars. Although these candles were not big enough to create threeDaily white soldiers, the steady upward pattern is bullish.
Euro Dollar / US Dollar broke above the upside resistance level of 1.32, 4 day(s) ago signifies a bullish sign. This previous resistance level of 1.32 may now provide downside support. And with prices having only risen 0.87% since the breakout, the validity of the breakout is questionable. The downside support level for Euro Dollar / US Dollar is around 1.28.
MACD is currently BULLISHwith the MACD above the signal line. The MACD crossed above the signal line 10 days ago. Since the MACD crossed the MACD moving average, Euro Dollar / US Dollar's price has increased 2.47%, and has fluctuate from a high of 1.337 to a low of 1.293.
RSI has just reached its highest value in the last 14 days. This is BULLISHsignal and currently the Momentum Oscillator is in an overbought condition. Directional Movement Indicators (DMI) and SAR signal was a BUY 11 days ago.
The close is now currently
ABOVE its 200 daily moving average
ABOVE its 50 daily moving average
ABOVE its 20 daily moving average
The current market condition for Euro Dollar / US Dollar is Very Bullish
Euro Dollar / US Dollar closed below the upper Bollinger Band by 1.0%. Bollinger Bands are 54.44% wider than normal. The large width of the Bollinger Bands suggest high volatility as compared to Euro Dollar / US Dollar's normal range. Therefore, the probability of volatility decreasing and prices entering (or remaining in) a trading range has increased for the near-term. The Bollinger bands have been in this wide range for 3 days. The probability of prices consolidating into a less volatile trading range increases the longer the Bollinger Bands remain in this wide range.
Please note that all wave counts are based on the high low price in this commentary!
Elliott Waves High Volatility has detected a possible point 4 of a WolfWave (21%) pattern for Euro Dollar / US Dollar. This pattern is an expanding triangle and trades from the next point. When the peak or trough will form, usually after crossing or touching the extended line of points 1 and 3, the price will move in the opposite direction towards the target line formed by the extension of points 2 and 4.
The present wave patterns are:
fast amplitude (8%): bullish wave 1
moderate amplitude (13%): bullish wave 3
Euro Dollar / US Dollar is long term Bullish as the 144 days moving average of 1.30 is increasing. The Relative Strength Index is at 70.18 in the overbought territory. The Relative Momentum Index is at 74.83 in the overbought territory. An important indicator for Elliott waves, the Elliott oscillator is at 0.02, in positive territory; this is a bullish sign. An equally important indicator, the STORSI is at 99.01. This value is in the overbought territory.
*** Intra-Daily Trading Strategy: SELLEURUSD
Sell Target:1.3337
Sell Stop: 1.3393
Enter New SELL on OPEN and exit SELL positions at Target price or at Stop price.
(PLEASE TAKE NOTE: If necessary, adjust the Stop Loss Price according to your trading risk.)
Do not reverse after exiting as Trending & Anti-Trending mode are being used by this system.
This is a recommendation for INTRA-DAY TRADING only!!!!!
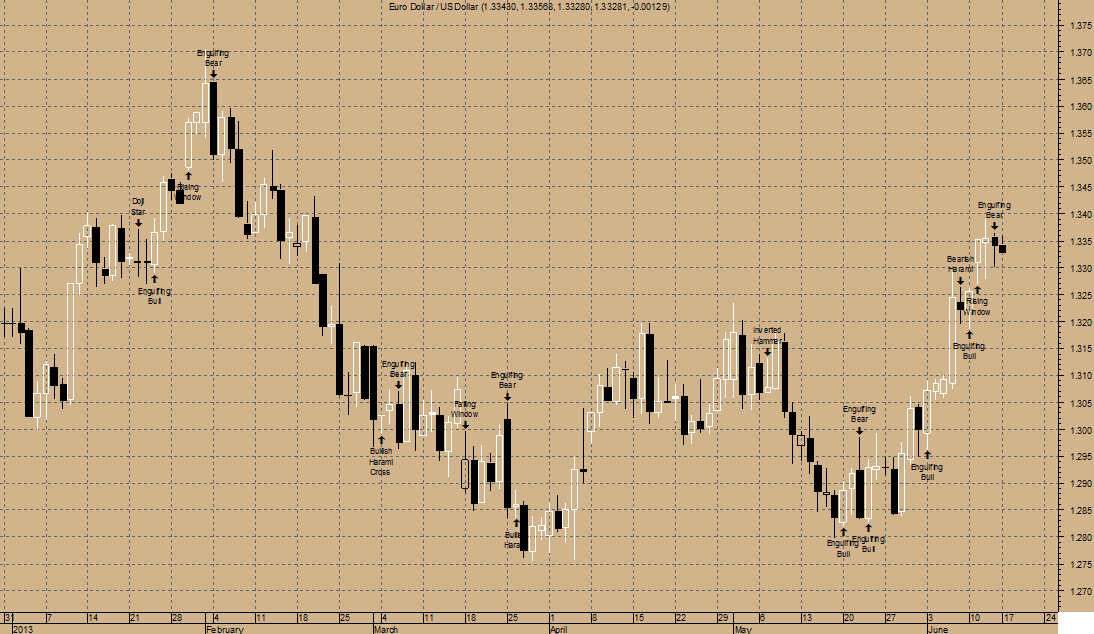
EUR/USD DAILYas ofMonday, 17 June, 2013
A Daily black body has formed (because prices closed lower than they opened).
For the past 10 Daily candlestick bars as of 17/06/2013, there are 7 white candles versus 3 black candles with a net of 4 white candles.
For the past 50 Daily candlestick bars as of 17/06/2013, there are 28 white candles versus 22 black candles with a net of 6 white candles.
MACD is currently BULLISH. The MACD is currently above the signal line. The MACD crossed above the signal line 11 period(s) ago. Since the MACD crossed the MACD moving average, Euro Dollar / US Dollar's price has increased 2.23%, and has fluctuate from a high of 1.339 to a low of 1.293. Currently, the Momentum Oscillator is in an overbought condition.
The last Directional Movement Indicators (DMI) and SAR signal was a BUY 12 period(s) ago.
The close is currently
ABOVE its 200 daily moving average
ABOVE its 50 daily moving average
ABOVE its 20 daily moving average
The current market condition for Euro Dollar / US Dollar is Very Bullish
On 17/06/2013, Euro Dollar / US Dollar closed below the upper Bollinger Band by 15.1%. Bollinger Bands are 63.22% wider than normal. The large width of the Bollinger Bands suggest high volatility as compared to Euro Dollar / US Dollar's normal range. Therefore, the probability of volatility decreasing and prices entering (or remaining in) a trading range has increased for the near-term. The Bollinger bands have been in this wide range for 4 period(s). The probability of prices consolidating into a less volatile trading range increases the longer the Bollinger Bands remain in this wide range.
Please note that all wave counts are based on the high low price in this commentary!
Elliott Waves High Volatility has detected a possible point 4 of a WolfWave (21%) pattern for Euro Dollar / US Dollar. This pattern is an expanding triangle and trades from the next point. When the peak or trough will form, usually after crossing or touching the extended line of points 1 and 3, the price will move in the opposite direction towards the target line formed by the extension of points 2 and 4. An Inside Day Narrow Range was detected by your Elliott Waves High Volatility on 17/06/2013. This is usually a trade set-up
The present wave patterns are:
fast amplitude (8%): bullish wave 1
moderate amplitude (13%): bullish wave 3
Elliott Waves High Volatility has detected a Gann Swing or Pullback that is usually a bullish pattern
Euro Dollar / US Dollar is long term Bullish as the 144 days moving average of 1.31 is increasing. The Relative Strength Index is at 67.20 in the neutral territory. The Relative Momentum Index is at 76.71 in the overbought territory. An important indicator for Elliott waves, the Elliott oscillator is at 0.02, in positive territory; this is a bullish sign. An equally important indicator, the STORSI is at 88.93. This value is in the overbought territory.
*** Intra-Daily Trading Strategy: SELLEURUSD
Sell Target:1.3318
Sell Stop: 1.3366
Enter New SELL on OPEN and exit SELL positions at Target price or at Stop price.
(PLEASE TAKE NOTE: If necessary, adjust the Stop Loss Price according to your trading risk.)
Do not reverse after exiting as Trending & Anti-Trending mode are being used by this system.
This is a recommendation for INTRA-DAY TRADING only!!!!!
- Free trading apps
- Over 8,000 signals for copying
- Economic news for exploring financial markets
You agree to website policy and terms of use
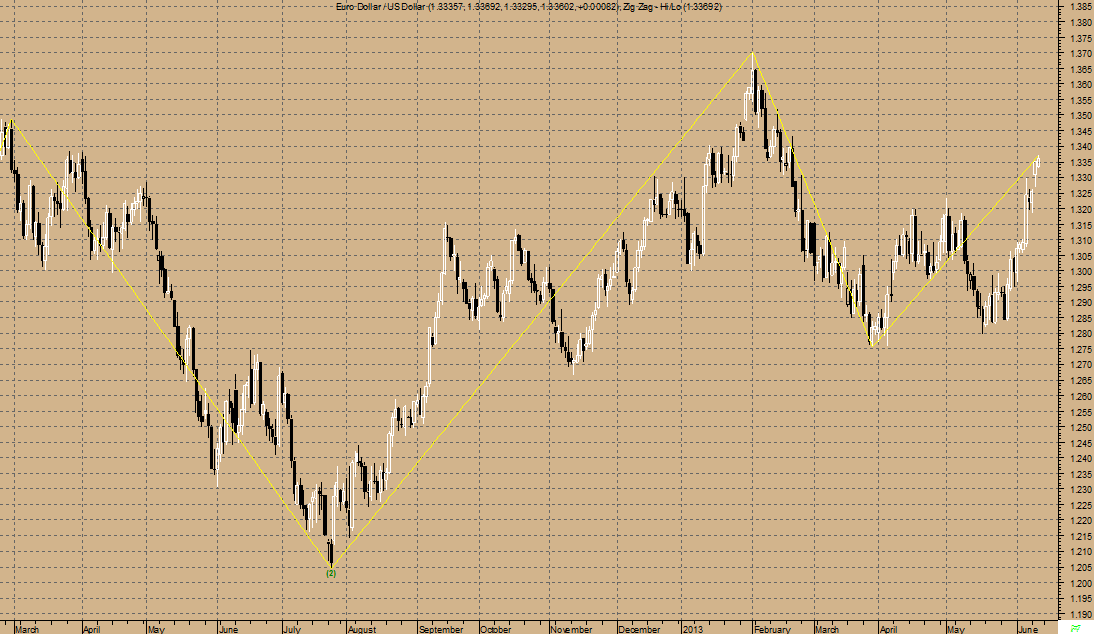
EUR/USD WEEKLY as of Monday, 13 May, 2013
Euro Dollar / US Dollar appears to be locked in a triangle formation bounded by a down trendline and an up trendline. The most recently confirmed down trendline for Euro Dollar / US Dollar has an ending point currently at 1.47. Expect prices to have some difficulty rising above this trendline. The most recently confirmed up trendline for Euro Dollar / US Dollar has an ending point currently at 1.21. Expect prices to have some difficulty falling below this trendline. A break below this trendline would be a bearish sign.
EUR/USD closes with a Weekly black body last week.
For the past 10 Weekly candlestick bars as of 10/05/2013, there are 5 white candles versus 5 black candles.
For the past 50 Weekly candlestick bars as of 10/05/2013, there are 26 white candles versus 23 black candles with a net of 3 white candles.
A Weekly engulfing bearish line has formed (where a black candle's real body completely contains the previous white candle's real body). The engulfing bearish pattern is bearish during an uptrend. It signifies that the momentum may be shifting from the bulls to the bears.
If the engulfing bearish pattern occurs during a downtrend (which appears to be the case with Euro Dollar / US Dollar), it may be a last engulfing bottom which indicates a bullish reversal. The test to see if this is the case is if the next candle closes above the bottom the current (black) candle's real body.
MACD is currently BEARISH. The MACD is currently trading below the signal line. The MACD crossed below the signal line 10 weekss ago. Since the MACD crossed the MACD moving average, Euro Dollar / US Dollar's price has decreased 0.21%, and has fluctuate from a high of 1.331 to a low of 1.276.
Stochastic signal was a Sell 18 weeks ago.
SAR signal was a Buy 2 weeks Ago.
The close is currently
BELOW its 200 weekly moving average
BELOW its 50 weekly moving average
BELOW its 20 weekly moving average
The current market condition for Euro Dollar / US Dollar is Very Bearish.
Elliott Waves High Volatility has detected a possible point 4 of a WolfWave (21%) pattern for Euro Dollar / US Dollar. This pattern is an expanding triangle and trades from the next point. When the peak or trough will form, usually after crossing or touching the extended line of points 1 and 3, the price will move in the opposite direction towards the target line formed by the extension of points 2 and 4
The present wave patterns are:
fast amplitude (8%): bullish wave 1
moderate amplitude (13%): bullish wave 3
Elliott Waves High Volatility has detected an Isolated High at 1.32one bar ago; this is usually a bearish.
Euro Dollar / US Dollar is long term Bearish as the 144 days moving average of 1.33 is decreasing. The Relative Strength Index is at 47.84 in the neutral territory. The Relative Momentum Index is at 50.83 in the neutral territory. An important indicator for Elliott waves, the Elliott oscillator is at -0.00, in negative territory; this is a bearish sign. An equally important indicator, the STORSI is at 77.52. This value is in the overbought territory.
Please note that all wave counts are based on the high low price in this commentary!
*** Intra-Daily Trading Strategy: BUY EUR/USD
Buy Target: 1.3048
Buy Stop: 1.2877
Enter BUY on OPEN and exit BUY at Target price or at Stop price.Do not reverse.
This recommendation is for INTRADAY TRADING ONLY!!!!