Predicting the next candle
Check this thread:
thank you for your reply. i checkout most of the indicators, they are not what i am looking for.
In simple words, I am trading binary options (hourly options) i need something that tells me about the next candle close.
Example, to what i have been testing.
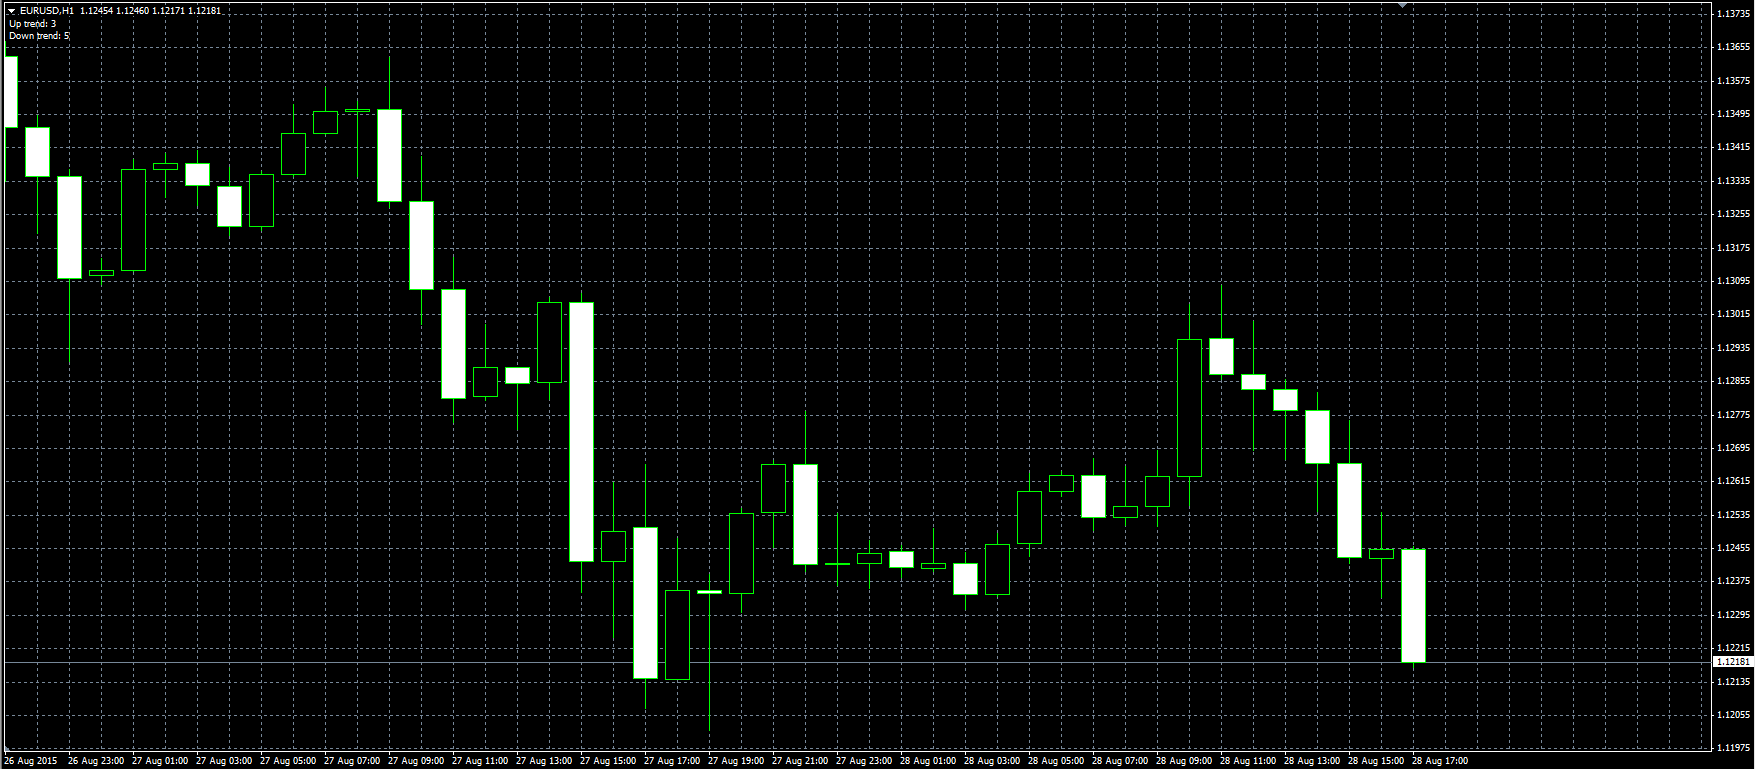
If you put parabolic SAR to certain pairs on an hourly chart, when the sar changes direction, the second bar closing after the change is mostly according to the trend. SAR says Up, Second bar closes below the first bar.
Now i might be wrong but again there are a lot of things that are like that. Suppose Supertrend after changing the direction the second bar "always" closes according to the trend. Problem, it re-paints...So you are back to square one.
I would really appreciate if anyone could help me on this.
There are 2 indicators on that thread (all of them are famous as created using good proven theory) which can tell you about the next candle close price for D1 timeframe. And those indicators can be backtested just to compare this forecasting with real results in past. May be - those indicators will work for H4 too. But about H1 timeframe - I am not sure sorry ...
So, read this thread one again.
May be I did not understand you so sorry ...
but why are you checking Supertrend?
If you need the indicator which will tell you about exact price (with somee good probability) for the next D1 candle close/high/low and so on for the next day in price by chart, with possibility to check the results about probability and so on - so check this thread once again.
My experience - I used 2 of them ... do not remember the name ... one is something related to Demark (in the beginning of the thread) ... the next one is something as Axel levels or something (somewhere in the middle) ... and some more indicators as the improvements of the previous ones ... and 2 more in the end of the thread.
Using last 2 indicators - everyone can create some good service about forecasting the next D1 candle. Because those indicators can be easy backtested on the chart, indicators are not repainted and we can see about real close/high/low and forecasting close/high/low for every past candle + forecasting on the future and so on ...
But I do not think that it will work for H1 timeframe. I think - it is for D1 and may be - for H4.
If you need something more special so it is only about market condition something similar with AbsoluteStrengh indicator but it is more complicated as to get the future price - you will need to analyze the market condition. And in case of H1 timeframe - you will not have a time to sit near PC for this analysis.
So, better to check this thread for D1/H4 indicators witout any market condition.
If you need something different so sorry - may be the other members will help.
Or you can use it on the way as the other people doing: some EMA or SMA indicators shifted on the chart.
I do not like MA indicator so I am not using it.
But it is well-known method (on that thread too by 1 post).
*************************************************************************************
May be I did not understand you so sorry ...
but why are you checking Supertrend?
If you need the indicator which will tell you about exact price (with somee good probability) for the next D1 candle close/high/low and so on for the next day in price by chart, with possibility to check the results about probability and so on - so check this thread once again.
My experience - I used 2 of them ... do not remember the name ... one is something related to Demark (in the beginning of the thread) ... the next one is something as Axel levels or something (somewhere in the middle) ... and some more indicators as the improvements of the previous ones ... and 2 more in the end of the thread.
Using last 2 indicators - everyone can create some good service about forecasting the next D1 candle. Because those indicators can be easy backtested on the chart, indicators are not repainted and we can see about real close/high/low and forecasting close/high/low for every past candle + forecasting on the future and so on ...
But I do not think that it will work for H1 timeframe. I think - it is for D1 and may be - for H4.
If you need something more special so it is only about market condition something similar with AbsoluteStrengh indicator but it is more complicated as to get the future price - you will need to analyze the market condition. And in case of H1 timeframe - you will not have a time to sit near PC for this analysis.
So, better to check this thread for D1/H4 indicators witout any market condition.
If you need something different so sorry - may be the other members will help.you can try nextcandle.com, it is free but be take care before making trading decisions. I have been following it for a few weeks and there are several equities it is doing very well on. they do not offer forex but they do offer commodities such as gold and oil...
there is no logic behind in counting candlesticks that go into the same direction as there is no rule, when a reversal will happen....
Hello all,
I need help from all the experts here.
Question?
Which indicator or strategy helps you predict (I know its not going to be 100% accurate) the closing of the next candle will be above or below the previous candle on hourly/daily/weekly charts?
Again i know there is no holy grail which could tell u something with 100% accuracy.
I just want to know about the most accurate thing available on the internet.
try to use multiple timeframes...and observe the candlestick closing of the higher tf with the candlestick opening of the lower tf. I think for the 1h tf is the 1 w too far away..you could compare the 15m and the 1h as the higher tf for example...
- Free trading apps
- Over 8,000 signals for copying
- Economic news for exploring financial markets
You agree to website policy and terms of use
Hello all,
I need help from all the experts here.
Question?
Which indicator or strategy helps you predict (I know its not going to be 100% accurate) the closing of the next candle will be above or below the previous candle on hourly/daily/weekly charts?
Again i know there is no holy grail which could tell u something with 100% accuracy.
I just want to know about the most accurate thing available on the internet.