You are missing trading opportunities:
- Free trading apps
- Over 8,000 signals for copying
- Economic news for exploring financial markets
Registration
Log in
You agree to website policy and terms of use
If you do not have an account, please register
Hi coders,
Is there a simple value chart (without all the dynamics etc) outhere that draws lines instead of bars? Like an RSI. So basically drawing the lines based on adjustable settings; when the value is above 0 then show lines based on close or high and when value is below 0 then show the lines based on close or low? I hope i explained it correctly and it make some sense.Or maybe i have to say it this way: show the lines in the direction of the highest OB/OS level with the highest value (high/low) for that candle.
Thanks!!
Angela1985
By definition value chart must have the 4 "prices", so there is no value chart that has just 1 "price"
Hi Seniors,
did you noticed value chart indi leaves behind a lot of objects on chart,every candle/bar leaves 2 objects,how how the time grow those became thousands and thousands,i dont know any thing about coding,what other indi does with their objects,is it normal,not a lot of memory consuming and over load on mt4 terminal ???
regards
Hi coders,
Is there a simple value chart (without all the dynamics etc) outhere that draws lines instead of bars? Like an RSI. So basically drawing the lines based on adjustable settings; when the value is above 0 then show lines based on close or high and when value is below 0 then show the lines based on close or low? I hope i explained it correctly and it make some sense.Or maybe i have to say it this way: show the lines in the direction of the highest OB/OS level with the highest value (high/low) for that candle.
Thanks!!
You need the whole bar, every useful information you can get. The VC is very valuable. It is like driving autoscooter or cushion a ball again and again. Much better than RSI or stochastics.
@mntiwana: It's ok, I run 4 VCs also on an older machine. This indi isn't a CPU-killer.
Hi Seniors,
did you noticed value chart indi leaves behind a lot of objects on chart,every candle/bar leaves 2 objects,how how the time grow those became thousands and thousands,i dont know any thing about coding,what other indi does with their objects,is it normal,not a lot of memory consuming and over load on mt4 terminal ???
regards
mntiwana
Unlike metatrader 5, metatrader 4 can not draw candles - so they need to be simulated. And the only way to simulate candles in metatrader 4 is to use objects. Otherwise we could not see those candles
Dear Malden....How it use to make two indicators like Syncfilters-low pass-apz- bands+value charts.when candle will touch low line then buy...Is it use full?
Dearest MLADEN,
Though it is out of topic here for DZ,but because it is about value charts,just now i found there is DZ value chart already,just it needs for some more favor for upgrade to slope colors all 2 MAs crossing lines and if possible with new prices too,it have a lot of options for alerting and arrows,thanks.
regards

dynamic_zone_value_chart_averages_arrows__alerts.ex4Hello all,
any chance to create a DSS of price as modified in Value Chart?
Thanks!
Regards
Lucmat
Hello all,
any chance to create a DSS of price as modified in Value Chart?
Thanks!
Regards
LucmatHi Mladen and Mrtools
Do you think it should be a good indicator a DSS of price as modified in value chart?
This modified price can be used also to build other indicators (macd, stocastic etc.)?
Thanks
Regards
Lucmat
Hi Mladen and Mrtools
Do you think it should be a good indicator a DSS of price as modified in value chart?
This modified price can be used also to build other indicators (macd, stocastic etc.)?
Thanks
Regards
LucmatCan it be done at all?
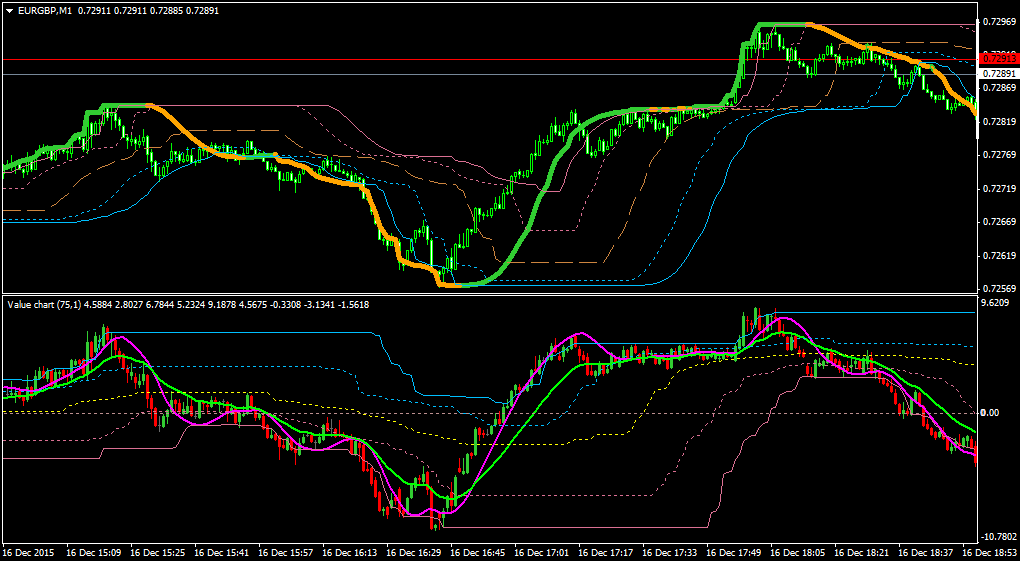
What is it? I don't really understand. A DSS of Value Chart or an Heiken Ashi of DSS or a Value Chart of the Heiken Ashi of DSS. The DZ Value Chart of Heiken Ashi works surprisingly well, see pic.