VERY SIMPLE. Interested in trying this?
Please Remove
Hi Moderator,
Kindly remove this thread if nobody is interested so we don't waste people's time looking here. Thanks!!
And by the way, does any of the senior members here happen to have an EA based on %R? Will appreciate it if you can direct it to me. I started this thread as I see some potential in it so if anyone can help me get the Williams %R EA, I will be very grateful.
No Crying
I've been using this manually for 6 months now and still very happy with it, how can I be crying? I'm looking for an easier way to do it, that's all. If you can help me get an EA for Williams%R, I'll be thankful to you. Cheers!!
I've been using this manually for 6 months now and still very happy with it, how can I be crying? I'm looking for an easier way to do it, that's all. If you can help me get an EA for Williams%R, I'll be thankful to you. Cheers!!
Thanks can you post your indicators
Please can you post your indicators and template that you are using?
Huh?? I'm no good in explaining maybe.
OK, go try this but it looked a little different on MetaTrader, I'm using FXCM's Trading Station.
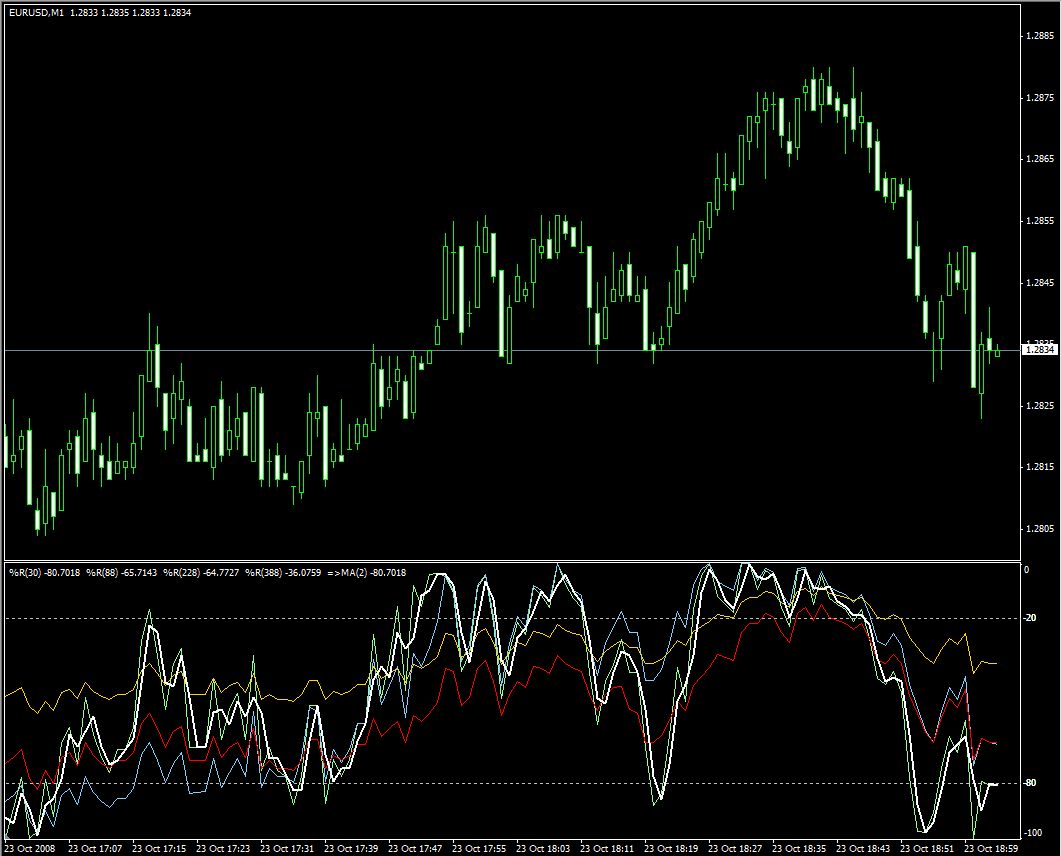
Set Williams Percentage Range (it's in the indi folder)
1st one 30(green), 2nd one 88(blue), 3rd one 228(red) and 4th one 388(silver)
I cannot put a Simple Moving Average on all Williams %R in MetaTrader but can do it on my platform.
Now do this for 1M TF, 5M TF & 15M TF. Look carefully and you will see something about the previous tops & bottoms.
Sorry, forgot to say, use it on EURUSD, haven't got time to look at other pairs, please do so if any of you have the time. The reason for starting this thread is hopefully you gurus out there would like to try code this.
Also, it'll take you some time to get used to looking at 4 indicators in 1 window, that's why I'm so tired :-}}
Huh?? I'm no good in explaining maybe.
OK, go try this but it looked a little different on MetaTrader, I'm using FXCM's Trading Station.
Set Williams Percentage Range (it's in the indi folder)
1st one 30(green), 2nd one 88(blue), 3rd one 228(red) and 4th one 388(silver)
I cannot put a Simple Moving Average on all Williams %R in MetaTrader but can do it on my platform.
Now do this for 1M TF, 5M TF & 15M TF. Look carefully and you will see something about the previous tops & bottoms.
Sorry, forgot to say, use it on EURUSD, haven't got time to look at other pairs, please do so if any of you have the time. The reason for starting this thread is hopefully you gurus out there would like to try code this.
Also, it'll take you some time to get used to looking at 4 indicators in 1 window, that's why I'm so tired :-}}I do not understand your English very well or explanation.
Please explain what Moving Average you use on your first chart and also every other part of this.
In the first post you made you described a different system than the one in your last post.
I am attaching a template file showing you that a moving average can be attached in the Williams Percentage window, all you do is click on the MA indicator and drag it over the Williams indicator and select use first indicator data in the Apply to box.
Hi Handymansg
thank u for sharing the system
please tell what are the goals of this system, do u close manually or by tp/trailing stop?
is this system working on higher timeframes?
Thank you
Hi FseXy, you got it right, I'm saying that I can't get all 4 %R to have MA attached to it, you can only do it to 1. All uses simple MA 8.
This is the more complicated one compared to the 1st post, that's the reason why I show the simple one first, for people to get used to %R before adding more.
Look at when all %R touches/very near the top and bottom, see chart top and bottom. It will take some time to explain and I will try to do it bit by bit.
STEX, my goal and anybody goals to any system is to consistently MAKE MONEY! and yes, I have to do everything manually and if I see strong moves, I'll put in trailing stop and a stop loss together with the entry order, because I'm no computer geek, I still have problem using MT platform. I'm not young anymore thank you. I would suggest that anyone who wants to do trading to stick to a system you're comfortable with, don't go round searching for one, get comfortable, get used and understand it, trying all will get you nowhere.
Thanks for posting your system. I look forward to you explaining further.
- Free trading apps
- Over 8,000 signals for copying
- Economic news for exploring financial markets
You agree to website policy and terms of use
Hi guys,
Anyone have the time and interest to try this?
Don't know if I attached correctly?
I'm just too tired tracking the chart and would like some help if any of you would be kind enough.
Hopefully, some programmer may see a potential in this and create an EA so we don't have to monitor the chart.
OK, here goes.
One have to wait for 3 indicator + 2 level to confirm a buy or sell.
1st one comes from %R - wait for it to reach more than -90 for a sell signal, when it goes above -90 and turn down below -90, this is the sell signal.
2nd, the MA for %R has to be also turning downwards like the %R.
3rd, the MA for the chart is also turning down for a sell signal.
Do the reverse at -10 for buy signals.
Once all these 3 signals are met, an order to sell/buy is executed and stop loss at 20 pips.
The trick to using this method is to set all indicators to "OPEN", not close!!
And you take profit at e.g.
You have a new sell and the market is going down, after several minutes, it hits lower than -10 and move up, after it move over -10 and all 3 signals are up, you take your profits (don't know how much, depend on strong or weak move) and put in a new buy order at the same time.
Hope all can understand it. Thanks! Gotta go sleep now, simply too tired, may have written some mistake. Nite.https://www.mql5.com/en/forum
Question