Chop indicator
Choppy huh?
Well for that definition I would look to woodies methods. Chop zone indicators. I have a few different ones but its best you find them yourself to know how to use them. Try a search for chop zone or CZI, something like that. I know theres several here somewhere.......
Choppy huh? Well for that definition I would look to woodies methods. Chop zone indicators. I have a few different ones but its best you find them yourself to know how to use them. Try a search for chop zone or CZI, something like that. I know theres several here somewhere.......
I find the CZI to be rather unreliable. The predominance of "chop" is supposed to be indicated by the rainbow effect on the underlying bars but the transition from brown and blue bars (trending) to rainbow (consolidation) lags considerably and gives off a lot of unreliable values during those phases. With 8 or so bar values for colors to poll from an EA, it's a bit of a mess imo. If you're trading manually, the rainbow doesn't show itself until well into the ranging period. A better method is to measure near-term price volatility - if you like indicators that is.
Thanks for the replies. I looked at the STIX and wasn't impressed immediately but I will continue to play with it. It was also interesting in the description posted that it uses volume but when I looked at the code it doesn't. My understanding is that volume is rather unreliable coming from spot FX brokers anyway:
"It compares the amount of volume flowing into advancing and declining stocks."
As for Woodie's CCI anything, I've already evaluated it thoroughly. I don't want to offend the Woodie groupies so I will just keep my mouth shut about that one.
Determining CHOPPY.....
The MA gets lost within the price bars
The RSI hangs around 50
The ADX is below 25 and falling
The DMI lines are all intertwined
this is from so document I had....
Just for information:
- forecasting in simple way: very good post.
- Forex Market Conditions, a graphic depiction: thread with image and explanation about markert condition.
- Woodie's choppy zone indicator: many choppy zone indicators from Igorad; original thread.
Meaning of the color in some Igorad's indicators:
MediumBlue: Strong UpTrend.
Crimson: Strong DownTrend
DodgerBlue: Retrace UpTrend
Tomato: Retrace DownTrend
LightBlue: Choppy UpTrend
Orange: Choppy DownTrend
Aqua: Be ready to change UpTrend
Yellow: Be ready to change DownTrend
- SideWinder for CCI: My first release: original thread started FX-Sniper.
- ZZi indicator: version of the CCI clearly shows OverBought and OverSold levels.
- Jurik Woodie CCI: indicators are here.
- CCI Filter: original thread with indicators and full explanation.
- market condition evaluation (incl choppy zones) and prediction using MTF_AbsoluteStrength_v1 indicator: original thread with indicators, live trading results and images; how to use indicator (rules): read all the pages starting from this page till this one.
- Indicator That Isolates SIDEWAYS Market: original thread; small indicator's collection with images;
- STIX: indicator attached.
in The Polymetric Report. It compares the amount of
volume flowing into advancing and declining stocks.
According to The Polymetric Report:
STIX usually ranges between +42 and +58.
If STIX gets as low as 45, the market is almost
always a buy, except in a raging bear market.
The market is fairly overbought if STIX rises to 56;
and except in a new bull market, it's wise to sell if
STIX should go over 58.
Traders and investors should modify these rough rules
to suit their own objectives.
In normal markets, STIX rarely gets as high as 56 or
as low as 45, so rigid use of these rules of
thumb would keep you inactive most of the time.
For active accounts, the rules might be made much
less stringent.
Extremely Overbought greater than 58
Fairly Overbought greater than 56
Fairly Oversold less than 45
Extremely Oversold less than 42Range Market EA
Could someone recommend a EA for range based markets?
Could someone recommend a EA for range based markets?
I moved your post to this thread (witgh redirection so you will find the new location easy - and also sent Pm to you for new location).
Of course your post is not fully related to this thread but ... just to decide/predict about what is range for example.
sideways indicator
is there any indicator which predict sideways trend?
See post #4 of this thread.
Indicator against sideway markets
I think i have good idea for such indicator, but unfortunatelly i can't write indicators... But maybe someone will know how to do that 
Here's idea:
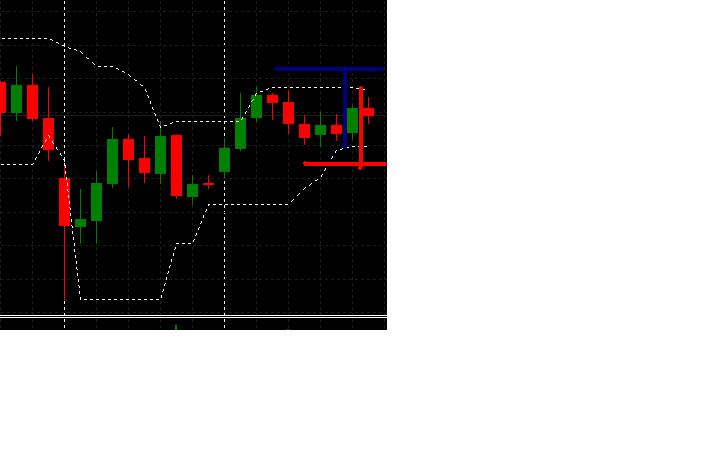
The base are 2 indicators - support resistance (white dashed line on a chart, value is 6- shows min/max from 6 last bars) and atr (everyone know whats that).
My idea is that this indicator will draw 2 lines in some distance from support resistance (distance based on atr) as it is shown on the chart.
Aim is to not enter long if price is under blue line and short if price is above red line.
I have noticed that 1,5atr filter is a good filter in flat trends.
There should be at least 3 parameters:
1) atr period
2) atr percentage parameter (for ex. 1.5 when line is suppose to be in distance of 150% of atr)
3) support resistane period (how many bars to include in min/max search)
I hope everything is understandable. Sorry for language
Cheers
- Free trading apps
- Over 8,000 signals for copying
- Economic news for exploring financial markets
You agree to website policy and terms of use
Could someone please suggest the best indicator that shows when the market is choppy?