Something Interesting in Financial Video October 2013 - page 8
You are missing trading opportunities:
- Free trading apps
- Over 8,000 signals for copying
- Economic news for exploring financial markets
Registration
Log in
You agree to website policy and terms of use
If you do not have an account, please register
Here we start to go over the trading signals of the ichimoku system. In this video we only talk about your Tekan-sen & Kijun-sen cross (TK Cross). We go over entry signals, strength of signal, stop-loss, profit target and filtering out the signals. We will go over the other signals in other video but until then hopefully someone is getting something from this.
Second part of the TK Cross video explaining about the Kumo future as a filter on your cross.
==================
Tenkan Sen / Kijun Sen Cross
The Tenkan Sen / Kijun Sen Cross signal occurs when the Tenkan Sen (Turning line) crosses the Kijun Sen (Standard line).
A bullish signal occurs when the Tenkan Sen crosses from below to above the Kijun Sen
- A weak bullish signal occurs when the cross is below the Kumo.
- A neutral bullish signal occurs when the cross is inside the Kumo.
- A strong bullish signal occurs when the cross is above the Kumo.
A bearish signal occurs when the Tenkan Sen crosses from above to below the Kijun SenKijun Sen Cross
The Kijun Sen Cross signal occurs when the price crosses the Kijun Sen (Standard line).
A bullish signal occurs when the price crosses from below to above the Kijun Sen
- A weak bullish signal occurs when the cross is below the Kumo.
- A neutral bullish signal occurs when the cross is inside the Kumo.
- A strong bullish signal occurs when the cross is above the Kumo.
A bearish signal occurs when the price crosses from above to below the Kijun Sen==================
How to use the Ichimoku System as Support and Resistance
Here is a video explaining how to use the Kumo as support and resistance for future reference on your charts.
Ichimoku - Senkou Span A And Senkou Span B
==========
Senkou Span A - 1st leading lineThe average of the Tenkan Sen and Kijun Sen, plotted 26 days ahead.
(Tenkan Sen + Kijun Sen) / 2 plotted 26 days ahead
The Senkou Span A, also known as the 1st leading line, is a moving average of the Tenkan Sen and Kijun Sen and is plotted 26 trading days ahead, i.e. into the future. It is primarily used in combination with the Senkou Span B to form the Kumo (cloud), to indicate probable future support and resistance levels.
As price tends to respect prior support and resistance levels, time-shifting this line forward gives a visual representation of how the price on a date relates to support and resistance from 26 trading days prior.
The trend is deemed to be bearish when the Senkou Span A is below the Senkou Span B and bullish when it is above.
==========
Senkou Span B - 2nd leading lineThe average of the highest high and lowest low over the last 52 days, plotted 26 days ahead.
(Highest high + Lowest low) / 2 over the last 52 trading days plotted 26 days ahead.
The Senkou Span B, also known as the 2nd leading line, is a moving average of the highest high and lowest low over the last 52 trading days is plotted 26 trading days ahead, i.e. into the future. As such it is the longest term representation of equilibrium in the Ichimoku system. It is primarily used in combination with the Senkou Span A to form the Kumo (cloud), to indicate probable future support and resistance levels.
As price tends to respect prior support and resistance levels, time-shifting this line forward gives a visual representation of how the price on a date relates to support and resistance from 52 trading days prior.
The trend is deemed to be bearish when the Senkou Span A is below the Senkou Span B and bullish when it is above.
==========
This video gives insights and tips for how to trade with moving averages on a short or longer term basis.
Forum
Indicators: Custom Moving Average
newdigital, 2013.07.31 07:53
Short-term Forex Trading with Moving AveragesShort term trading will use short period moving averages such as the 10 and 20 moving average.
In the example below we use 10 and 20 moving averages to generate Forex signals; the signals generated are able to identify the trend as early as possible.
Scalper Trading Using Moving Averages
One of the most widely used method of technical analysis used to trade price fluctuations in scalp trading is the use of moving averages. moving averages is an indicator that provides a profitable chart structure for scalp trader.
The idea behind moving averages is to simply enhance analysis before taking a signal to enter the market. Planning and setting goals in the short-term according to moving averages helps a trader to identify interests in the market and thus trade accordingly.
Most of the targets can be established using a specific period on MA. The moving averages determines whether the trader will scalp in a short-term long-term. In addition, the price action above or below the price determines the state of the market for the trading day.
If a large part of the price action is considered to be below the MA, then bias trade/forex trend for the day is short. Most traders the use the MA as support or resistance to determine where to enter a trade, if price touches the MA in the direction of the forex trend a trade is then opened.
The moving averages are plotted and the intersection point with the price action can be used to determine the appropriate entry and exit times in the market. Since there is always oscillation in the forex trends and activities of the price action on the market, the price will repeat this process of oscillating and bouncing off the MA and this can be used to generate forex trading signals.
Scalp trader use moving averages define the price floor in an upward Forex trend and price ceiling in a downward Forex trend.
Simple moving averages are calculated and their approach is based on the observation of price within a particular period of time using sufficient data to calculate the moving averages is what moving average are all about? The interpretation of the moving averages has provided many scalp traders with lots of tips on how and when to trade a currency.
Medium-term Trading with Moving Average
Medium term trading will use the 50 period MA.
The 50 period MA acts as support or resistance level for the price.
In an uptrend the 50 period MA will act as a support, price should always bounce back up after touching the MA. If price closes below the MA then it is an exit signal.
50 period MA Support
In a downtrend the 50 period MA will act as a resistance, price should always go down after touching the moving average. If price closes above the moving average then it is an exit signal.
50 Day Moving Average Analysis in the Forex Market
As your currency pair moves up in price, there is a key line you want to watch. This is the 50 day moving average. If your currency pair stays above it, that is a very good sign. If your currency pair drops below the line in heavy volume, watch out, there could be reversal ahead.
A 50 day MA line takes 10 weeks of closing price data, and then plots the average. The line is recalculated everyday. This will show a currency pair's price trend. It can be up, down, or sideways.
You normally should only buy currency pairs that are above their 50 day MA. This tells you the currency pair is trending upward in price. You always want to trade with the trend, and not against it. Many of the world's greatest traders, past and present, only trade or traded in the direction of the trend.
When a successful currency pair corrects in price, which is normal, it may drop down to its 50 day MA.
Winning currency pairs normally will find support over and over again at that line. Big trading institutions such as mutual funds, pension funds, and hedge funds watch top currency pairs very closely. When these big volume trading entities spot a great currency pair moving down to its 50 day line, they see it as an opportunity, to add to, or start a position at a reasonable price.
What does it mean if your currency pair price slices downward through its 50 day line. If it happens on heavy volume, it is a strong signal to sell the currency pair. This means big institutions are selling their shares, and that can cause a dramatic drop in price, even if fundamentals still look solid. Now, if your currency pair drops slightly below the 50 day line on light volume, watch how the currency pair acts in the following days, and take appropriate action if necessary
Long-term Trading with Moving Average
Long term trading will use long period moving averages such as the 100 and 200 moving average.
These moving averages act as long term support and resistance levels. Since many traders use the 100 and 200 moving averages price will often react to these support and resistance levels.
Learn about the 200 day MA
In Forex Trading, investors can use both fundamental analysis and technical analysis to help determine whether a currency pair is a good buy or sell.
In technical analysis technique traders looking to gauge supply and demand for a currency use the 200 day moving average to examine data in different ways.
Traders are most familiar with the basic analysis of MA. The 200 day moving average is used to plot the long term support or resistance level. If price is above 200 day MA then price is bullish, and if it is below then it is bearish.
One of the ways to measure supply and demand is to calculate the average closing price over the last 200 trading sessions. this accounts for each day going back in time and shows how this 200 day average has moved hence the term 200 day MA.
The reason why the average 200 day MA in particular is so popular in technical analysis is because historically has been used with profitable results for trading in the forex market. A popular timing strategy is used to buy when price action is above its moving average of 200 days and sell when it goes below it.
With individual currency pairs, investors can benefit from being notified when a currency pair rises above, or falls below its 200 day Moving Average and then use fundamental analysis to help determine if the signal is an opportunity to go long or short.
Breakouts with the ATR
Forum
Indicators: ATR_MA_Oscillator
newdigital, 2013.10.23 18:52
An Easy and Advanced Way to Set StopsTalking Points:
- Stops are a necessity because no trading strategy wins 100% of the time
- Traders can use ATR to calculate stop distances based on recent price activity
- Price Action can be used to set stops in trending, or ranging market environments
As traders, we know we need them, but it’s much like the advice of ‘get your annual checkup with a Doctor,’ where most of us simply don’t want to do it.But in the field of trading, risk management isn’t just a preference; it’s a necessity.
And the reason for this is simple: Because you cannot tell the future. And this means that no matter how hard you try, or how great a trader you become, you will simply never be able to avoid losing entirely. And as a natural extension of that fact, since you will lose on some trades, having sloppy risk management means that one or two losers can wipe away the gains of many small winners.
I know this may sound too simplistic; but this is exactly what was found to be The Number One Mistake that Forex Traders Make: They often win more frequently than they lose - but they lose so much when they are wrong that it wipes away all of the gains from their winners and then some.
Average losses (in red) far outpace average wins (in blue) :
The first step to avoiding The Number One Mistake Forex Traders Make is to set a stop. This allows you to cap the risk on any one trade, so that if it doesn’t go in your direction, you can stem the bleeding before it becomes too unbearable.
Below, we’re going to look at two popular, yet different ways of setting stops. One easy way that is often employed by professional traders for the sake of simplicity; and another more advanced method that may suit certain trading styles more adequately.
The Easy Way
First off, just because this is an easier way of setting a stop does not make it any less valid. This is classified as ‘the easy way’ simply because most traders can pick this up right now, and begin using it instantly with a minimum of instruction.
Average True Range is a favorite indicator of many professional traders, and one of the great things about it is that it’s rather simple in its design. While many indicators wear multiple hats and try to do a few different things at once, ATR is just a measure of price movements over a specific period of time.
If those movements increase in value, ATR goes up. If those movements decrease, ATR goes down (see below).
ATR measures volatility, and this allows traders to set stops based actual market behavior :
There are a few nuances of ATR that traders need to know before applying. We cover these, in depth in the article Managing Risk with ATR. The first is the format with which the indicator displays values. While it looks like an oscillator like RSI, and moves similar to an indicator like ADX; the real value of ATR is in its value. It will measure the ‘Average True Range’ of the last x periods, where x is the input you choose. The default, and most common input for ATR is 14 periods. The value of ATR will read in the price format of the currency pair being analyzed. So, for instance; if a value of .00760 is shown on EURUSD, that means 76 pips (4th place to the right of the decimal is a single pip in the quote).
ATR displays values in the format of the currency pair’s price :
There is a slightly easier option, and for traders that are using short-term techniques this can be extremely helpful. There is a custom indicator available for Trading Station desktop that automatically calculates, and displays ATR on the chart in a very easy-to-read format. This is completely free, and can be downloaded from the FXCM App Store at this link (link). As you can see below, not only does it display ATR, but it even rounds the ‘.6’ fractional pip as appropriate.
The ‘ATR_Pips’ Indicator displays Average True Range in an easy-to-read format :
The Advanced Way
Price Action can have a huge impact on a trader’s performance. Inclusion of price action into an approach will often take place regardless of the trader or type of trading being done. Price action can help traders read trends, find support and resistance, and perhaps most importantly - manage risks.
Because, after all - if prices are trending higher, and we’re seeing continuous higher-highs, and higher-lows, wouldn’t it be reasonable to consider closing the trade if the trend reversed?
Remember, this is the number one mistake traders make, and this is the reason stops are so important. If the trend reverses, the trader’s best advice is often to close the trade and look for greener pasture elsewhere... because if the reversal continues against the trader, one loss can wipe away a lot of gains.
If traders are trading a trend, they can look to the previous opposing-side swing for stop placement. So, if an up-trend is being traded, we should be able to see higher-highs, and higher-lows. If we are buying to take part in the up-trend, we can look to place our stop below the prior swing-low (see picture).
During an up-trend, stops can be placed below the previous swing-low :
On the other hand, if we’re selling in a down-trend, we would want to look to place our stop above the prior swing-high.
During down-trend, stops can be placed above the previous swing-high
In How to Analyze and Trade Ranges with Price Action, we look at stop placement in
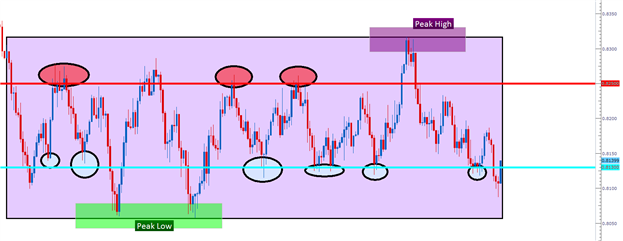
range-bound markets. If a range is being traded, the ‘peak-high’ and ‘peak-low’ should be identified (see below).
Traders can look to place their stop just outside of the peak of the opposing side of their position. So, if buying, traders would look to place their stop just below the peak-low; and if selling just above the peak-high. This way, if the range turns into a breakout against the trader, the bleeding can be stopped before one loser wipes away the gains from a lot of winners.
If you’d like to become a better Price Action trader, we’ve put together the basics into a Brainshark curriculum. The link below will take you directly to the lesson, and after filling in a few pieces of information into the guestbook the session will begin.
The next lesson in free online video futures trading course which covers how futures are traded.
============
What is Futures Trading?
Futures Trading is a form of investment which involves speculating on the price of a commodity going up or down in the future. What is a commodity? Most commodities you see and use every day of your life:
- the corn in your morning cereal which you have for breakfast,
- the lumber that makes your breakfast-table and chairs
- the gold on your watch and jewellery,
- the cotton that makes your clothes,
- the steel which makes your motor car and the crude oil which runs it and takes you to work,
- the wheat that makes the bread in your lunchtime sandwiches
- the beef and potatoes you eat for lunch,
- the currency you use to buy all these things...
... All these commodities (and dozens more) are traded between hundreds-of-thousands of investors, every day, all over the world. They are all trying to make a profit by buying a commodity at a low price and selling at a higher price.Futures trading is mainly speculative 'paper' investing, i.e. it is rare for the investors to actually hold the physical commodity, just a piece of paper known as a futures contract.What is a Futures Contract?
To the uninitiated, the term contract can be a little off-putting but it is mainly used because, like a contract, a futures investment has an expiration date. You don't have to hold the contract until it expires. You can cancel it anytime you like. In fact, many short-term traders only hold their contracts for a few hours - or even minutes!
The expiration dates vary between commodities, and you have to choose which contract fits your market objective. For example, today is June 30th and you think Gold will rise in price until mid-August. The Gold contracts available are February, April, June, August, October and December. As it is the end of June and this contract has already expired, you would probably choose the August or October Gold contract. The nearer (to expiration) contracts are usually more liquid, i.e. there are more traders trading them. Therefore, prices are more true and less likely to jump from one extreme to the other. But if you thought the price of gold would rise until September, you would choose a further-out contract (October in this case) - a September contract doesn't exist. Neither is their a limit on the number of contracts you can trade (within reason - there must be enough buyers or sellers to trade with you.) Many larger traders/investment companies/banks, etc. may trade thousands of contracts at a time!
A Short History of Futures Trading
Before Futures Trading came about, any producer of a commodity (e.g. a farmer growing wheat or corn) found himself at the mercy of a dealer when it came to selling his product. The system needed to be legalised in order that a specified amount and quality of product could be traded between producers and dealers at a specified date. Contracts were drawn up between the two parties specifying a certain amount and quality of a commodity that would be delivered in a particular month...
...Futures trading had begun!
In 1878, a central dealing facility was opened in Chicago, USA where farmers and dealers could deal in ‘spot’ grain, i.e., immediately deliver their wheat crop for a cash settlement. Futures trading evolved as farmers and dealers committed to buying and selling future exchanges of the commodity. For example, a dealer would agree to buy 5,000 bushels of a specified quality of wheat from the farmer in June the following year, for a specified price. The farmer knew how much he would be paid in advance, and the dealer knew his costs.
Until twenty years ago, futures markets consisted of only a few farm products, but now they have been joined by a huge number of tradable ‘commodities’. As well as metals like gold, silver and platinum; livestock like pork bellies and cattle; energies like crude oil and natural gas; foodstuffs like coffee and orange juice; and industrials like lumber and cotton, modern futures markets include a wide range of interest-rate instruments, currencies, stocks and other indices such as the Dow Jones, Nasdaq and S&P 500.
Who Trades Futures?
It didn't take long for businessmen to realise the lucrative investment opportunities available in these markets. They didn't have to buy or sell the ACTUAL commodity (wheat or corn, etc.), just the paper-contract that held the commodity. As long as they exited the contract before the delivery date, the investment would be purely a paper one. This was the start of futures trading speculation and investment, and today, around 97% of futures trading is done by speculators.
There are two main types of Futures trader: 'hedgers' and 'speculators'.
A hedger is a producer of the commodity (e.g. a farmer, an oil company, a mining company) who trades a futures contract to protect himself from future price changes in his product.
For example, if a farmer thinks the price of wheat is going to fall by harvest time, he can sell a futures contract in wheat. (You can enter a trade by selling a futures contract first, and then exit the trade later by buying it.) That way, if the cash price of wheat does fall by harvest time, costing the farmer money, he will make back the cash-loss by profiting on the short-sale of the futures contract. He ‘sold’ at a high price and exited the contract by ‘buying’ at a lower price a few months later, therefore making a profit on the futures trade.
Other hedgers of futures contracts include banks, insurance companies and pension fund companies who use futures to hedge against any fluctuations in the cash price of their products at future dates.
Speculators include independent floor traders and private investors. Usually, they don’t have any connection with the cash commodity and simply try to (a) make a profit buying a futures contract they expect to rise in price or (b) sell a futures contract they expect to fall in price.
In other words, they invest in futures in the same way they might invest in stocks and shares - by buying at a low price and selling at a higher price.
The Advantages of Trading Futures
Trading futures contracts have several advantages over other investments:
1. Futures are highly leveraged investments. To ‘own’ a futures contract an investor only has to put up a small fraction of the value of the contract (usually around 10%) as ‘margin’. In other words, the investor can trade a much larger amount of the commodity than if he bought it outright, so if he has predicted the market movement correctly, his profits will be multiplied (ten-fold on a 10% deposit). This is an excellent return compared to buying a physical commodity like gold bars, coins or mining stocks.
The margin required to hold a futures contract is not a down payment but a form of security bond. If the market goes against the trader's position, he may lose some, all, or possibly more than the margin he has put up. But if the market goes with the trader's position, he makes a profit and he gets his margin back.
For example, say you believe gold in undervalued and you think prices will rise. You have $3000 to invest - enough to purchase:
- 10 ounces of gold (at $300/ounce),
- or 100 shares in a mining company (priced at $30 each),
- or enough margin to cover 2 futures contracts. (Each Gold futures contract holds 100 ounces of gold, which is effectively what you 'own' and are speculating with. One-hundred ounces multiplied by three-hundred dollars equals a value of $30,000 per contract. You have enough to cover two contracts and therefore speculate with $60,000 of gold!)
Two months later, gold has rocketed 20%. Your 10 ounces of gold and your company shares would now be worth $3600 - a $600 profit; 20% of $3000. But your futures contracts are now worth a staggering $72,000 - 20% up on $60,000.Instead of a measly $600 profit, you've made a massive $12,000 profit!
2. Speculating with futures contracts is basically a paper investment. You don’t have to literally store 3 tons of gold in your garden shed, 15,000 litres of orange juice in your driveway, or have 500 live hogs running around your back garden!
The actual commodity being traded in the contract is only exchanged on the rare occasions when delivery of the contract takes place (i.e. between producers and dealers – the 'hedgers' mentioned earlier on). In the case of a speculator (such as yourself), a futures trade is purely a paper transaction and the term 'contract' is only used mainly because of the expiration date being similar to a ‘contract’.
3. An investor can make money more quickly on a futures trade. Firstly, because he is trading with around ten-times as much of the commodity secured with his margin, and secondly, because futures markets tend to move more quickly than cash markets. (Similarly, an investor can lose money more quickly if his judgement is incorrect, although losses can be minimised with Stop-Loss Orders. My trading method specialises in placing stop-loss orders to maximum effect.)
4. Futures trading markets are usually fairer than other markets (like stocks and shares) because it is harder to get ‘inside information’. The open out-cry trading pits -- lots of men in yellow jackets waving their hands in the air shouting "Buy! Buy!" or "Sell! Sell!" -- offers a very public, efficient market place. Also, any official market reports are released at the end of a trading session so everyone has a chance to take them into account before trading begins again the following day.
5. Most futures markets are very liquid, i.e. there are huge amounts of contracts traded every day. This ensures that market orders can be placed very quickly as there are always buyers and sellers of a commodity. For this reason, it is unusual for prices to suddenly jump to a completely different level, especially on the nearer contracts (those which will expire in the next few weeks or months).
6. Commission charges are small compared to other investments and are paid after the position has ended.
Commissions vary widely depending on the level of service given by the broker. Online trading commissions can be as low as $5 per side. Full service brokers who can advise on positions can be around $40-$50 per trade. Managed trading commissions, where a broker controls entering and exiting positions at his discretion, can be up to $200 per trade.
============