Ichimoku cloud: settings
Hi zeno,
According to what I understand - if we change the settings/parameters of Ichimoku indicator - we will change all. Example :
Forum on trading, automated trading systems and testing trading strategies
USDJPY Technical Analysis 23.06 - 30.06 : Rally Finishing to Ranging
newdigital, 2013.06.27 12:07
Well ... what I am explaining here by text and charts - it is understandable for traders. But there are traders and coders on the forum. And I think we all know that they are using different "forex english" in some cases. So, I am just translating some terms/words I am using for technical Ichimoku analysis onto "coding english" language :) :
- Tenkan Sen - moving average of the highest high and lowest low over the last 9 trading days. (Highest high + Lowest low) / 2 over the last 9 trading days
- Kijun Sen - moving average of the highest high and lowest low over the last 26 trading days. (Highest high + Lowest low) / 2 over the last 26 trading days.
- Senkou Span A - the average of the Tenkan Sen and Kijun Sen, plotted 26 days ahead. (Tenkan Sen + Kijun Sen) / 2 plotted 26 days ahead
- Senkou Span B - the average of the highest high and lowest low over the last 52 days, plotted 26 days ahead. (Highest high + Lowest low) / 2 over the last 52 trading days plotted 26 days ahead.
- Chikou Span - the closing price plotted 26 days behind.
And you can see the parameters of Ichimoku :
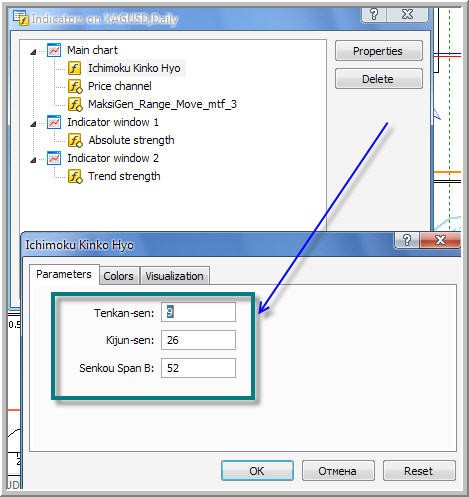
The settings of Ichimoku is 9/26/52 by default :
- Tenkan is 9
- Kijun is 26
- Senkou Span B is 52
Senkou Span B is one of the border of the cloud (value can be changed in Ichimoku indicator's input, and Senkou Span A = (Tenkan Sen + Kijun Sen) / 2 plotted 26 days ahead so changing and Kijun - we are changing Sinkou Span A by this way.
Some more information about :
Forum on trading, automated trading systems and testing trading strategies
Something Interesting in Financial Video October 2013
newdigital, 2013.10.28 11:24
Ichimoku - Senkou Span A And Senkou Span B
==========
The average of the Tenkan Sen and Kijun Sen, plotted 26 days ahead.
(Tenkan Sen + Kijun Sen) / 2 plotted 26 days ahead
The Senkou Span A, also known as the 1st leading line, is a moving average of the Tenkan Sen and Kijun Sen and is plotted 26 trading days ahead, i.e. into the future. It is primarily used in combination with the Senkou Span B to form the Kumo (cloud), to indicate probable future support and resistance levels.
As price tends to respect prior support and resistance levels, time-shifting this line forward gives a visual representation of how the price on a date relates to support and resistance from 26 trading days prior.
The trend is deemed to be bearish when the Senkou Span A is below the Senkou Span B and bullish when it is above.
==========
Senkou Span B - 2nd leading lineThe average of the highest high and lowest low over the last 52 days, plotted 26 days ahead.
(Highest high + Lowest low) / 2 over the last 52 trading days plotted 26 days ahead.
The Senkou Span B, also known as the 2nd leading line, is a moving average of the highest high and lowest low over the last 52 trading days is plotted 26 trading days ahead, i.e. into the future. As such it is the longest term representation of equilibrium in the Ichimoku system. It is primarily used in combination with the Senkou Span A to form the Kumo (cloud), to indicate probable future support and resistance levels.
As price tends to respect prior support and resistance levels, time-shifting this line forward gives a visual representation of how the price on a date relates to support and resistance from 52 trading days prior.
The trend is deemed to be bearish when the Senkou Span A is below the Senkou Span B and bullish when it is above.
==========
Thank you newdigital for your response.
I was in particular trying to resolve the following, since I am familiar with Ichimoku: 'how to project Ichimoku cloud in the future'? The problem on my chart is that it does not. The Ichimoku cloud does not look into the future, and only goes as far as current price.
I am sorry if I was not clear in my initial posting.
Many thanks.
I am using default Ichimoku indicator (default in MT5) and no problem at all ...
I had this issue but it was something about the scale of the chart. You can try to open new chart, and zoom in or zoom out the chart in metatrader to see the cloud in the future.
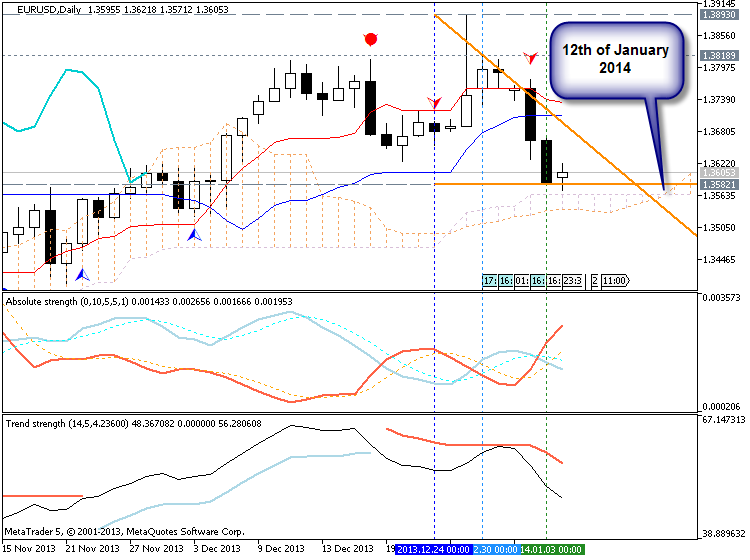
For example - this is cloud in the future with Ichimoku on EURUSD D1 (we see that price reversal will be in 12th of January this month)
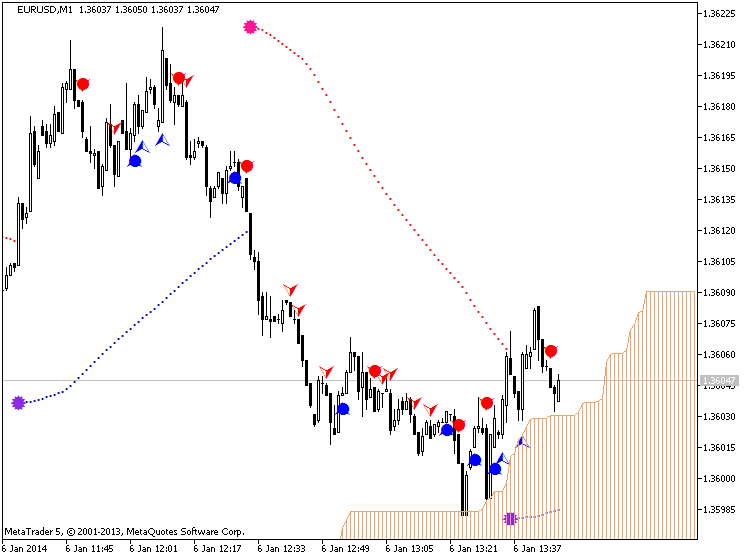
For M1, M5 and M15 timeframes - I am using 72/144/288 settings :
In this case - same: open new chart, attach default Ichimoku, and zoom in and zoon out the chart ...
or look at chart properties (because it may be something with scale for example).
I am using default Ichimoku indicator (default in MT5) and no problem at all ...
I had this issue but it was something about the scale of the chart. You can try to open new chart, and zoom in or zoom out the chart in metatrader to see the cloud in the future.
For example - this is cloud in the future with Ichimoku on EURUSD D1 (we see that price reversal will be in 12th of January this month)
For M1, M5 and M15 timeframes - I am using 72/144/288 settings :
In this case - same: open new chart, attach default Ichimoku, and zoom in and zoon out the chart ...
or look at chart properties (because it may be something with scale for example).
- Free trading apps
- Over 8,000 signals for copying
- Economic news for exploring financial markets
You agree to website policy and terms of use
Hello,
In the Ichimoku cloud settings (Senkou Span A and B lines), these look forward some periods. How can this be specified in the settings of the cloud? In my current settings, they are at the level of current price.
I have looked on the forum to find an answer, since I believe I read about it on mql5. I cannot find the explanation though.
Many thanks for your help.