Something Interesting in Financial Video October 2013 - page 5
You are missing trading opportunities:
- Free trading apps
- Over 8,000 signals for copying
- Economic news for exploring financial markets
Registration
Log in
You agree to website policy and terms of use
If you do not have an account, please register
How To trade forex using moving average
158. How to Trade Stocks on Margin Part 1
The next lesson in our free video stock trading course, which covers the basics of day trading stocks on margin.
Indicators - Mass Index
This is very short video (very very short ...i do not like short videos sorry) so it may be good to read some article first just to understand about (just a suggestion)
Forum
Indicators: Mass Index
newdigital, 2013.09.27 17:26
Mass IndexThe Mass Index is used to warn of a future price reversal. The theory behind the Mass Index is that reversals occur when the price range [high - low] increases (i.e. more volatility).
The chart below of the E-mini S&P 500 future shows the Mass Index warning of an impending price reversal:
The components for a Mass Index reversal of trend, "Reversal Bulge" as the creator of the Mass Index, Donald Dorsey refers to it, are listed below:
The Mass Index is a useful technical tool that traders can use to time entry into bottoming markets.
... and read whole this page about how to make profit with Mass Index indicator - read live example with Metatrader 5.
===============
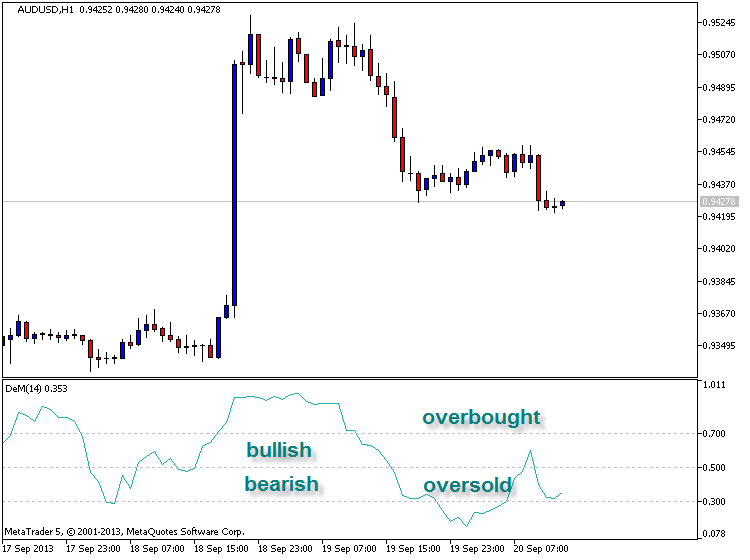
DeMarker Indicator (download indicator from MT5 CodeBase here)
The DeMarker indicator is an indicator used in technical analysis that compares the most recent price to the previous candle's price, attempting to measure whether there is substantial demand for the currency pair.
Forum
Indicators: DeMarker (DeM)
newdigital, 2013.09.20 13:17
DeMarker Indicator
The DeMarker indicator named after Thomas DeMark is a momentum oscillator very similar in nature to the Relative Strength Index (RSI) developed by Welles Wilder. By comparing inter-period price maxima and minima the DeMarker indicator attempts to gather information about price movements to help determine the underlying trend strength and identify over-bought/sold trade conditions. One of the main benefits of the DeMarker indicator like the RSI is that they are less prone to distortions seen in indicators such as the Rate of Change (ROC), which are introduced by erratic price movements at the start of the analysis window which can cause sudden shifts in the momentum line even when the current price is little changed.
The Default time span for the calculation of the DeMarker indicator is 14 periods. The overbought and oversold lines are typically drawn at 0.7 and 0.3, respectively. Longer time spans in the calculation will result in shallower swings in the oscillator and vice versa, accordingly traders may wish to construct narrower overbought and oversold lines for longer time periods. DeMarkers based on short time spans experience greater volatility and are more suitable for indicating overbought and oversold conditions, whereas longer time spans with more stable trajectories are better suited for constructing trend-lines and analyzing price patterns.
Trade Signals-Ranging MarketsTraders should look to go long when the DeMarker falls below 0.3 and rises back above it or where there is a bullish divergence with price where the first trough is below 0.3. Traders should look to go short when the DeMarker rises above 0.7 and falls back below it or where there is a bearish divergence with price where the first peak is above 0.70. Failure swings (see RSI for example of a failure swing) strengthen other signals.
Trade Signals- Trending MarketsTraders should look to go long during an up-trend, when the DeMarker falls below 0.4 and rises back above it and go short in a down trend when the DeMarker rises above 0.6 and falls back below it. Traders may wish to take profit on divergences or exit using a trend indicator. Traders should avoid selling/buying at overbought/oversold levels in strongly trending markets as subsequent periods of sideways trading can return the oscillator to more normal levels without any material favourable movement in the direction of the trade.
Zig-Zag Indicator
The Zig-Zag Indicator is in some ways part moving average, and part oscillator. The reason for this is that it simply tries to smooth out noise in the marketplace and allow a trader to see clear trends. It can also be used to help identify certain patterns as well, such as the head and shoulders technical pattern.
Forum
Indicators: ZigZag
newdigital, 2013.09.26 08:26
The Zig-Zag indicator is extremely useful for determining price trends, support and resistance areas, and classic chart patterns like head and shoulders, double bottoms and double tops. The Zig-Zag indicators uses both swing highs and swing lows in its calculation:
The Zig-Zag indicator can use both percentages or points in its construction. To construct the Zig-Zag indicator, there must be a certain percentage or number of points between a swing high and a swing low before a line will be drawn. The chart below of the E-mini Nasdaq 100 Futures contract visually illustrates the difference between a price retracement Zig-Zag of 3% and a price retracement Zig-Zag of 5%:
Notice how in the chart above that a Zig-Zag with a retracement percentage of 3% makes more distinct lines than the Zig-Zag with a retracement percentage of 5%. The purpose of using a Zig-Zag with a larger retracement percentage is to help eliminate price noise that is not significant for the trader's analysis.
Zig-Zag indicator is extremely effective at uncovering stock cycles while screening out short-term price noise.
The Zig-Zag indicator is extremely effective in filtering short-term noise and identifying significant trends and significant changes in market prices.
Below is a chart of the E-mini S&P 500 Futures contract that illustrates how effective the Zig-Zag indicator was in finding areas of support and resistance and price breakouts:
The chart above of the e-mini uses a 5% Zig-Zag retracement value; therefore, only price changes of 5% or greater are shown, helping a long-term trader or investor determine important areas of support, resistance, and areas of price breakouts.
On the left of the chart, the S&P 500 was forming a triangle consolidation pattern. When prices broke resistance, a long-term buy was generated. During the middle of the chart, the Zig-Zag indicator was effective in illustrating that the S&P 500 was in an upward price channel. Buying in areas where price touched the lower support trendline and selling when prices touched the upper resistance line would have proved extremely profitable.
Using the Zig-Zag indicator for shorter-term trades can prove profitable as well. The chart below of Intel (INTC) shows a classic chart head and shoulder pattern easily seen by the Zig-Zag indicator ($1 retracement):
The easily identified head and shoulders pattern gave a sell signal when price on the right shoulder broke the upward slanting trendline.
The Zig-Zag indicator is an excellent technical analysis tool for identifying classic charting patterns. The Zig-Zag indicator is also effective in reducing noise and helping the technical trader see the true market direction.
The second of two lessons on trading stocks on margin which covers the basic rules surrounding trading the stock market on margin.
The next 4 videos are related to the following book :
Trading with Intermarket Analysis, Enhanced Edition: A Visual Approach to Beating the Financial Markets Using Exchange-Traded Funds (Wiley Trading): John J. Murphy
With global markets and asset classes growing even more interconnected, intermarket analysis—the analysis of related asset classes or financial markets to determine their strengths and weaknesses—has become an essential part of any trader's due diligence. In Trading with Intermarket Analysis, John J. Murphy, former technical analyst for CNBC, lays out the technical and intermarket tools needed to understand global markets and illustrates how they help traders profit in volatile climates using exchange-traded funds.
Armed with a knowledge of how economic forces impact various markets and financial sectors, investors and traders can profit by exploiting opportunities in markets about to rise and avoiding those poised to fall. Trading with Intermarket Analysis provides advice on trend following, chart patterns, moving averages, oscillators, spotting tops and bottoms, using exchange-traded funds, tracking market sectors, and the new world of intermarket relationships, all presented in a highly visual way.
==================
John Murphy Explains Intermarket Analysis, Part 1In these videos you will learn from the author of several best-selling books, including Technical Analysis of the Financial Markets about:
In these videos you will learn from the author of several best-selling books, including Technical Analysis of the Financial Markets