GBPUSD Technical Analysis and Forecast 05.05 - 12.05 : Bullish
Price is on sideway market condition floating between support and resistance lines. I think - it may be correction after breakout which was on last week. Our recommendation - wait for long for the price to cross resistance levels.
Yes, the correction was started on H4 timeframe and breakdown with price reversal to bearish is going on right now for H1. I think - we can expect the correction on D1 timeframe next days.
MetaTrader Trading Platform Screenshots
MetaQuotes Software Corp., MetaTrader 5, Demo
gbpusd h1 correction going on

MetaTrader Trading Platform Screenshots
MetaQuotes Software Corp., MetaTrader 5, Demo
gbpusd h1 breakdown with possible price reversal

Breakdown was started on H4 timeframe for this pair:
MetaTrader Trading Platform Screenshots
MetaQuotes Software Corp., MetaTrader 5, Demo
gbpusd h4 breakdown started

I mean: if the price will break 1.5520 from above to below so it may be good to open sell trade. But if we look at H1 timeframe:
MetaTrader Trading Platform Screenshots
MetaQuotes Software Corp., MetaTrader 5, Demo
gbpusd h1 ranging

we will see that market is on ranging market condition - it may be good for "martingale people" and for "scalpers" but not good for trend follwing systems. So, I will have for the next opposunity.
Yes, breakdown: +25 pips in profit for now
MetaTrader Trading Platform Screenshots
MetaQuotes Software Corp., MetaTrader 5, Demo
gbpusd h4 breakdown

First take profit level will be at 1.5483
And this is how this breakdown looks in PriceChannel Parabolic system
MetaTrader Trading Platform Screenshots
MetaQuotes Software Corp., MetaTrader 5, Demo
gbpusd m30 price channel

Do you see red dotted line? this is support line by MaksiGen indicator. So, it is how this system looks in the combination with MaksiGen trading system
Yes, breakdown: +25 pips in profit for now
First take profit level will be at 1.5483
Yes, this level was taken:


+304 dollars
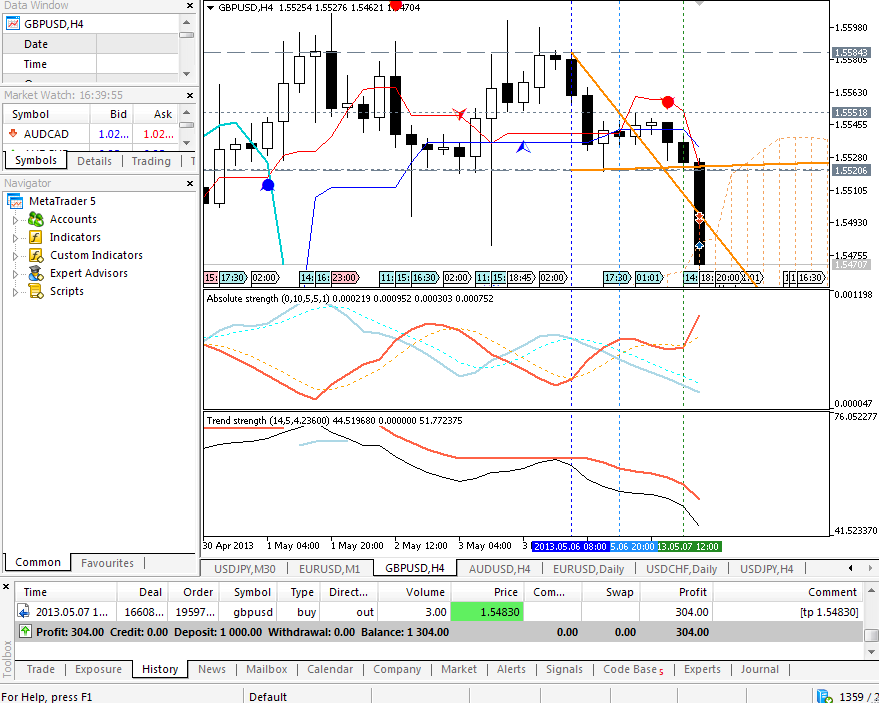
Does anyone need money? if yes so read this threrad from the beginning Market Condition Evaluation based on standard indicators in Metatrader 5 because market condition understanding = money
Breakout was started on H1 timeframe (on open bar for now sorry):
MetaTrader Trading Platform Screenshots
MetaQuotes Software Corp., MetaTrader 5, Demo
gbpusd breakout

And breakout may be started on H4 on open bar (just to remind that we are trading on close bar):

Anyway - I opened buy trade ... (you see it from the image above)
This is updated situation for right now: +12 pips in profit
MetaTrader Trading Platform Screenshots
MetaQuotes Software Corp., MetaTrader 5, Demo
gbpusd h4 breakout

- www.mql5.com
- Free trading apps
- Over 8,000 signals for copying
- Economic news for exploring financial markets
You agree to website policy and terms of use
Last week GBPUSD broke Sinkou Span B line to primary reversal to bullish market condition and the price was on sadeway in the end of the week. Price broke 1.5494 resistance line (which is the border of Ichimoku cloud namely Sinkou Span B) and stayed above the cloud witholut any correction and any breakout of 1.5605 resistance level.
If the price will break 1.5418 support line so we may have ranging market condition. if the price will break 1.5575 and 1.5605 resistance lines so the bullish trend will be continuing with good profit for the traders.
UPCOMING EVENTS (high/medium impacted news events which may be affected on GBPUSD price movement for the next week)
2013-05-06 13:00 GMT | [EUR - ECB President Draghi Speaks]
2013-05-09 08:30 GMT | [GBP - Manufacturing Output]
2013-05-09 11:00 GMT | [GBP - Interest Rate]
2013-05-10 13:30 GMT | [USD - Fed Chairman Bernanke Speaks]
SUMMARY : Bullish
TREND : Sideway
Intraday Analysis
Price is on sideway market condition floating between support and resistance lines. I think - it may be correction after breakout which was on last week. Our recommendation - wait for long for the price to cross resistance levels.