Some Ideas to Select Trading Signals - page 10
You are missing trading opportunities:
- Free trading apps
- Over 8,000 signals for copying
- Economic news for exploring financial markets
Registration
Log in
You agree to website policy and terms of use
If you do not have an account, please register
I thank you for your analysis on this spreadsheet.
As a moderator you could suggest something like that to MetaQuote to put available in the website 'MQL5' so we can to choose and analyze the signals. I know I should not be easy, but it sure is possible.
The customers would choose the signs and values of the score, the other statistics, the website 'MQL5' would give us automatically.
...I will not put 0 for a percentage less than 1% per month. See my proposal above.
In Brazil a personal investment with guaranteed monthly income above 1% per month is very good and rare some bank offer, below 1% in the Brazil there many investments guaranteed, so I will not risk my money in forex options if I have options secured in this level here.
Therefore, I put on the table a yield less than 1% = 0 points
Fator de lucro <1.0 é um sistema de perder. Fator de lucro = valor absoluto de (Lucro Bruto / Prejuízo Bruto).
Eu realmente não sei o valor a ser colocado na tabela , mas 0,05 é resultado de muito errado eu acho.
Então, você tem que ir muito maior do que 1,0.
copy and paste .... :(
but in the spreadsheet is is as follows.
Recovery Factor
I think I'm wrong in this assessment.
I did the proportion of operations of consecutive gains for consecutive losses and did not take into consideration the gain value and lost value, this may cause a error in the final result.
See the examples:
signal A
Operation with 48 Wins and Value Gain: 427.70
Operation with 2 losses and Value lost: -179.69
48/2 = 24 ( so what is in the spreadsheet I made)
427.70/179, 89 = 2.377564067
signal B
Operation with 13 Wins and Value Gain: 438 425.09
Operation with 19 losses and Value lost: -42 274.11
13/19 = 0,68
425.09 / 42 274.11 = 10.371
Let's compare the signal A with the signal B:
Looking only at the number of successful operations against lost, the signal A is better than B
SIGNAL A
Operation with 48 Wins
GOOD!!!!!!!!!!!!
Operation with 2 losses
SIGNAL B
Operation with 13 Wins
BAD !!!!!!!!!!!!!!!!
Operation with 19 losses
Looking for amounts earned against amounts lost, the signal B is better than A.
SIGNAL A
Value Gain: 427.70
GOOD
Value lost: -179.69
SIGNAL B
Value Gain: 438 425.09
VERY GOOD!!!!!!!!!!!!
Value lost: -42 274.11
So because of this I concluded that in this item I have that to modify.
I'll change the spreadsheet, placing the values gain and lost rather than the number of operations
I think I'm wrong in this assessment.
I did the proportion of operations of consecutive gains for consecutive losses and did not take into consideration the gain value and lost value, this may cause a error in the final result.
Why are you using Maximum (consecutive Win/loss) and not total Win/Loss ? This can make a big difference, especially if signal is irregular. The factor that you get is actually a kind of Profit Factor, but I wonder about its representativeness.
Why are you using Maximum (consecutive Win/loss) and not total Win/Loss ? This can make a big difference, especially if signal is irregular.
The signal has many operations consecutives of victories and few defeats, but money gains is only 10% greater than the volume of losses, with sure is a signal very aggressive. When it loses, it loses much!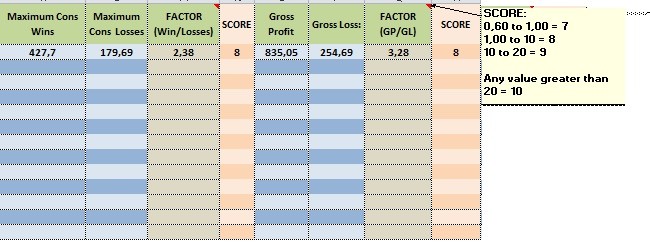
O sinal tem muitas operações consecutivas de vitórias e algumas derrotas, mas os ganhos de dinheiro é apenas 10% maior do que o volume de perdas, com certeza é um sinal muito agressivo. Quando perde, perde muito!
Attention! the last attached spreadsheet , I did not protect, follow the attached spreadsheet protected for anyone unconfigure