 MetaTrader 5
 Experts
 Indicators
 Scripts
 Libraries
 Storage
Join our fan page

AIS Smoothed Linear Trend - indicator for MetaTrader 5

- Views:
- 2845
- Rating:
- Published:
- Updated:
-
 You are missing trading opportunities:
- Free trading apps
- Over 8,000 signals for copying
- Economic news for exploring financial markets
Registration Log inYou agree to website policy and terms of use
If you do not have an account, please register -
 Need a robot or indicator based on this code? Order it on Freelance
Go to Freelance
Need a robot or indicator based on this code? Order it on Freelance
Go to Freelance
One of the main drawbacks of the simple moving average (SMA) is that it lags behind market trends. To reduce this lag, the average rate of price movement can be taken into account. The proposed indicator incorporates three different algorithms for measuring price. The central velocity provides a smoother value.
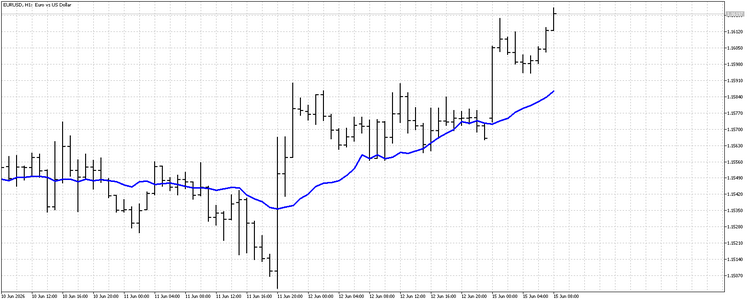
Forward velocity is measured relative to the current bar. This makes the indicator more sensitive to recent price changes.
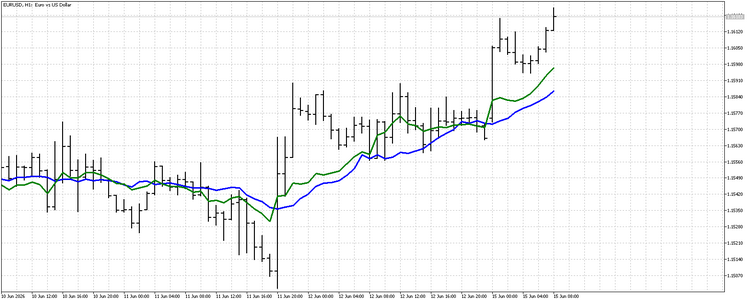
Backward velocity is measured relative to the initial bar, which allows the history of price movements to be taken into account.
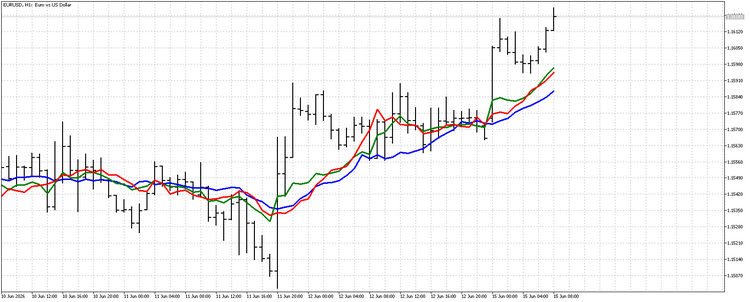
Using any of the three options reduces lag. As a result, this indicator can be used as a replacement for the standard SMA.
Indicator parameters:
- Type – a parameter allowing you to select the type of velocity measurement.
- iPeriod – the indicator’s period.
Translated from Russian by MetaQuotes Ltd.
Original code: https://www.mql5.com/ru/code/74004
MA Gauge Pro - AKM
Dynamic approach vastly outperforms relying on a single MA.
 Aegis Quantum Lite
Educational MT5 Expert Advisor using completed-candle EMA 9/21 alignment and RSI 14 filtering, with fixed-lot execution and a compact black-and-gold dashboard.
MACD TradingView Style for MT5
MACD indicator replicating TradingView’s visual style for MT5. 4-colour histogram, SMA-based signal line — values match TradingView bar-for-bar.
Rainbow Ranga - AKM
This indicator is essentially a GPS based on envelope as channel gauging and weather radar for the market wrapped into one. Instead of just giving you a bunch of lines to guess at, it calculates the mathematical "stretch" of the market and combines it with a multi-timeframe trend analysis to tell you exactly where you are. if price is outside band it is some fundamental shift in momentum happening if you are on wrong side then quit and stay away or go with trend on pull backs