Join our fan page

Gold FVG Finder - indicator for MetaTrader 5

I specialize in algorithmic trading and the development of robust Expert Advisors (EAs). With a strong background in complex process automation and systemic business logic, I approach trading as a precise, emotionless mechanism.
My priorities in EA development include:
- Views:
- 4365
- Rating:
- Published:
- Updated:
-
 You are missing trading opportunities:
- Free trading apps
- Over 8,000 signals for copying
- Economic news for exploring financial markets
Registration Log inYou agree to website policy and terms of use
If you do not have an account, please register -
 Need a robot or indicator based on this code? Order it on Freelance
Go to Freelance
Need a robot or indicator based on this code? Order it on Freelance
Go to Freelance
Gold FVG Finder
The indicator searches for areas of market imbalance on the chart and signals with an arrow when the price returns to such an area for the first time. Suitable for Gold, Forex and any liquid instruments on timeframes ranging from M5 to H4.
What is a Fair Value Gap?
A Fair Value Gap (an area of unfair pricing) is a section of the chart through which the price has moved too quickly. A gap forms between the shadows of the first and third candles, which is not covered by the body of the middle candle. In such zones, major market players leave unfilled orders, and the price almost always returns there to close them. It is precisely this return that forms the basis of the indicator’s logic.
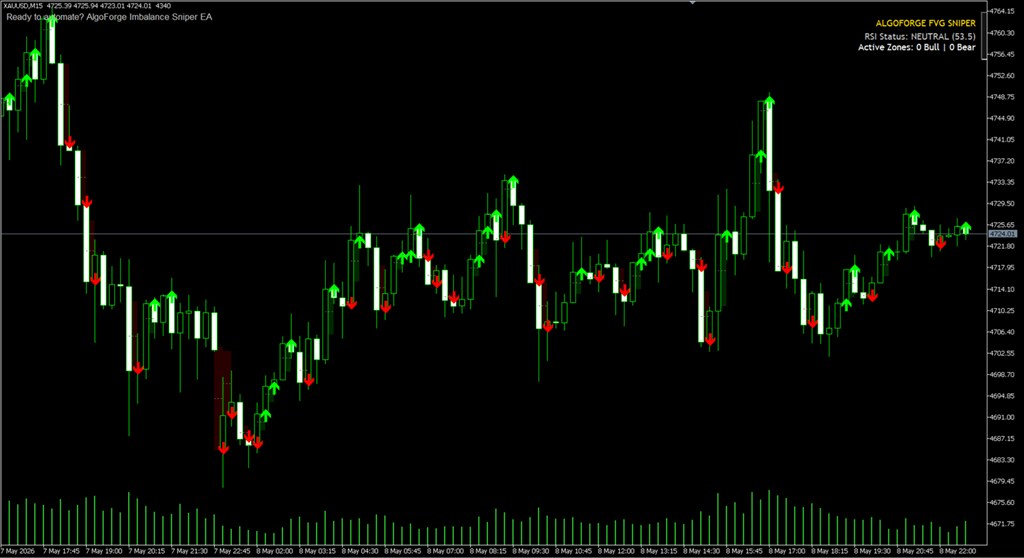
What is displayed on the chart
- Green rectangles — FVG bullish zones (an upward move is expected when the price retraces)
- Red rectangles — FVG bearish zones (a downward move is expected when the price retraces)
- The dotted line within each zone — the 50% level, Consequent Encroachment (the most accurate entry target within the zone)
- Green upward arrow — buy signal when the price touches the bullish zone
- Red down arrow — sell signal when the price touches a bearish zone
- The information panel in the top right-hand corner — the current RSI value and the number of active zones on the screen
Once a zone has been touched for the first time, it is considered to have been triggered and no longer generates signals, so as to avoid generating repeated entry signals at the same point.
Settings
- Use RSI Filter — enable an additional RSI filter. Disabled by default; signals are generated only when the zone is touched
- RSI Period — the RSI calculation period (default 14)
- RSI Oversold — the RSI level for buy signals when the filter is enabled (default 40)
- RSI Overbought — the RSI level for sell signals when the filter is enabled (default 60)
- Use Alerts — enable pop-up notifications when a signal is triggered
- Bull Colour — the colour of FVG’s bullish zones
- Bear Colour — the colour of the bearish FVG zones
- Line Colour — the colour of the 50% line within the zone
- Max History — the depth of the history used to plot the zones (number of bars)
Recommended timeframe
Recommended timeframe:M15. This is the timeframe on which the indicator was tested on Gold (XAUUSD) and demonstrates the best balance between the number of signals and their quality. On the M15, intraday zones of imbalance are clearly visible, which the price regularly retests during a single trading session.
The H1 timeframe is suitable for more relaxed trading with fewer signals, but each signal will carry greater weight. The M1 and M5 timeframes are not recommended — they contain too many minor zones that create noise. The FVG strategy is versatile and works equally well on currency pairs and stock indices.
Trading recommendations
The indicator provides a point of interest, not a ready-made entry order. The best results are achieved when a touch of the FVG zone coincides with a major support or resistance level on a higher timeframe. Do not enter a trade against a clear trend simply because the price has touched the zone. Always use a stop-loss, placing it outside the FVG zone.
Translated from Russian by MetaQuotes Ltd.
Original code: https://www.mql5.com/ru/code/73049
Session Boxes
Session Boxes is a custom indicator for MetaTrader 5 that draws color-coded rectangular boxes on the chart representing the high-low range of the Asia, London, and New York trading sessions. The indicator uses H1 data internally and supports configurable session hours in GMT along with a broker server offset parameter
Long-Term Trend TRIX Oscillator
A long-term momentum and trend oscillator based on dual TRIX and LWMA filtering.
 V1N1 LONNY MT5
Asian Range Breakout day-trading EA. Multi-symbol, M15/M30/H1. Places pending stop orders during the London session outside the pre-London Asian range, using PSAR + MACD + Stochastic signals, with automatic London/NY DST handling, structural stops, trailing and break-even.
Simple EMA Cross EA with SL/TP and Magic Number
A simple Expert Advisor based on the crossover of two EMAs (fast and slow), with configurable Stop Loss, Take Profit, lot size, and Magic Number.