Join our fan page

EQ Dashboard - indicator for MetaTrader 5

I write in mql4 and mql5. In my market you will find a variety of products, every day I develop something new, I research something. New indicators and advisors will appear in the near future.
- Views:
- 3896
- Rating:
- Published:
-
 You are missing trading opportunities:
- Free trading apps
- Over 8,000 signals for copying
- Economic news for exploring financial markets
Registration Log inYou agree to website policy and terms of use
If you do not have an account, please register -
 Need a robot or indicator based on this code? Order it on Freelance
Go to Freelance
Need a robot or indicator based on this code? Order it on Freelance
Go to Freelance
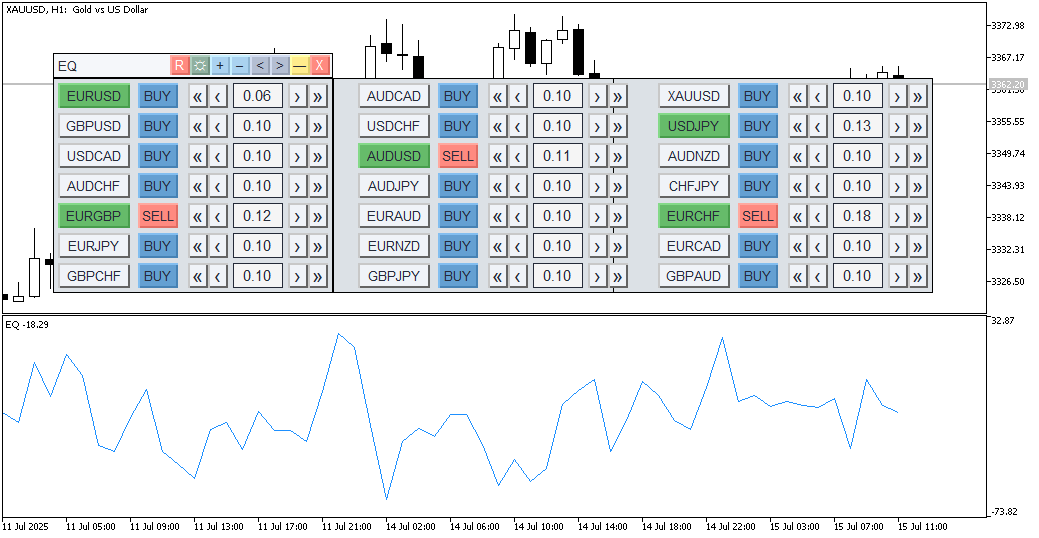
Interface development of the previous version of the indicator:
+ Automatic tracking of "Market Watch", adding and deleting symbols
+ Automatic rendering of any changes in active symbols
+ Automatic temporary saving of settings when deleting or switching off the terminal
+ Interface: reset, colour theme, mashstabbing, split into bars, minimise, close (deleting from the indicator chart)
OBJECTIVE:
- To identify volatility-flattening constructs for spread/equity trading
- visual analysis of spread trading efficiency
- identification of entry/exit moments for equity trading
- volume and direction are set once for each active pair
- cumulative profit/loss from all positions is calculated
- the result is displayed as an equity line in the subwindow.
- Set volumes, directions and activation of pairs
- Set the depth of the drawing history (in bars)
- Set initial balance (optional)
NOTES:
- spread, commission and swaps are not included in the calculations.
At present, this is an experimental sample on a poorly disclosed technique of profit extraction from spread/equity trading.
There are no definitions, no instructions, knowledge on the subject is fragmentary and contradictory in some places.
I decided to write to understand thesubject.
Currently forum activity on thesubjectis here: https://www.mql5.com/ru/forum/475752
FURTHER STEPS:
.
- Visual analysis of the effectiveness of flat strategies "from channel boundaries": adding optional Bollinger/Converts/Dynamic Levels and others
- Automation of identifying the best (or best) portfolio/basket designs for spread/equity trading, the main thing: finding or creating a suitable formula for this (I'm not good at maths, this is the hardest part).
- Algorithmisation of trading (creation of the EA itself) with favourable results
PS:
Either here or in the https://www.mql5.com/ru/forum/475752 thread, you can share your opinions/knowledge/comments on the topic and on the indicator. Somebody's implementation of the indicator will be even better.
Translated from Russian by MetaQuotes Ltd.
Original code: https://www.mql5.com/ru/code/61499
 Similarity Based Market Watch Symbol Mapping Script
This script is a reference solution for mapping symbol names configured by users in MetaTrader 5 EAs or scripts to the actual names provided by the broker. It uses the Levenshtein distance algorithm to automatically identify the most similar symbol in Market Watch. Ideal for developers facing compatibility issues with prefixes or suffixes in symbol names. It is a customisable starting point to suit any specific need.
 Outbreak Trader 1.0
Breakout Trader 1.0 trades breakouts from the range.
Price Percentage Zigzag (No timeframes)
Zigzag which changes wave direction based on price percentage change on the asset
BotCilento
BotCilento is a sophisticated grid-trading Expert Advisor for MetaTrader 5 that combines trend-following signals with adaptive risk management.