Join our fan page

EQ - indicator for MetaTrader 5

I write in mql4 and mql5. In my market you will find a variety of products, every day I develop something new, I research something. New indicators and advisors will appear in the near future.
- Views:
- 3145
- Rating:
- Published:
-
 You are missing trading opportunities:
- Free trading apps
- Over 8,000 signals for copying
- Economic news for exploring financial markets
Registration Log inYou agree to website policy and terms of use
If you do not have an account, please register -
 Need a robot or indicator based on this code? Order it on Freelance
Go to Freelance
Need a robot or indicator based on this code? Order it on Freelance
Go to Freelance
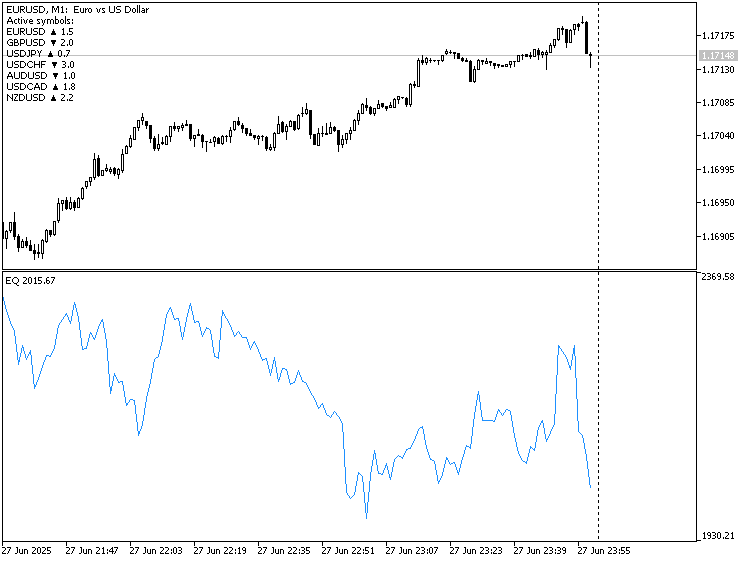
Historical equity of one-time and one-time open virtual positions to visually analyse spread/equity trading performance
OBJECTIVE:
- to identify volatility-flattening constructs for spread/equity trading
- visual analysis of spread trading efficiency
- identification of entry/exit points for equity trading
WORKING PRINCIPLE:
- volume and direction are set once for each active pair
- cumulative profit/loss from all positions is calculated
- the result is displayed as an equity line in the subwindow.
HOW TO USE:
- Set up volumes, directions and activation of pairs
- Specify symbol suffix (if required)
- Set the depth of the drawing history (in bars)
- Set initial balance (optional)
NOTES:
- spread, commission and swaps are not taken into account in calculations
- the number of symbols is strictly limited
- the indicator is not optimised in terms of content and possibly in terms of performance, because I do not have OOP knowledge and skills.
At the moment it is an experimental sample of a poorly disclosed technique of profit extraction from spread/equity trading.
There are no definitions, no instructions, knowledge on the subject is fragmentary and contradictory in some places.
I decided to write to understand the subject.
Currently forum activity on the subject can be found here: https://www.mql5.com/ru/forum/475752
FURTHER STEPS:
.
- Visual analysis of the effectiveness of flat strategies "from channel boundaries": adding optional Bollinger/Converts/Dynamic Levels and others.
- Creating a dashboard and displaying all available symbols on the chart with each symbol assigned to an activation/direction/locality to customise the indicator "on the go" with immediate sketching of new parameters
- Automating the identification of the best (or best) portfolio/basket designs for spread/equity trading, the main thing: finding or creating a suitable formula for this (I'm not good at maths, this is the hardest part)
- Algorithmisation of trading (creation of the EA itself) with favourable results
PS:
Either here or in the https://www.mql5.com/ru/forum/475752 thread, you can share your opinions/knowledge/comments on the topic and on the indicator. Somebody's implementation of the indicator will be even better.
Translated from Russian by MetaQuotes Ltd.
Original code: https://www.mql5.com/ru/code/60962
Bull Bear Volume
An indicator that provides a clear visualization of volume pressure on each side of the market
BBMA ZoneZeroLoss (ZZL) Grandma Ally
BBMA ZoneZeroLoss Histogram shows trading zones e.g. for "Reentry" setup for risk minimisation
 Checking the server time changes due to the summer time changeover
Unfortunately I had to realise that some brokers are a bit careless with the server time changeover, which I had not expected and which surprised me a lot. Here is a script with which everyone can check their broker.
Checking the time change on the server due to daylight saving time transition
Unfortunately, I found that some brokers Changing the time on the server is a bit incorrect, which I didn't expect. and which surprised me a lot. Here is a script that anyone can use to check their broker.