Join our fan page
- Views:
- 4918
- Rating:
- Published:
- Updated:
-
 You are missing trading opportunities:
- Free trading apps
- Over 8,000 signals for copying
- Economic news for exploring financial markets
Registration Log inYou agree to website policy and terms of use
If you do not have an account, please register -
 Need a robot or indicator based on this code? Order it on Freelance
Go to Freelance
Need a robot or indicator based on this code? Order it on Freelance
Go to Freelance
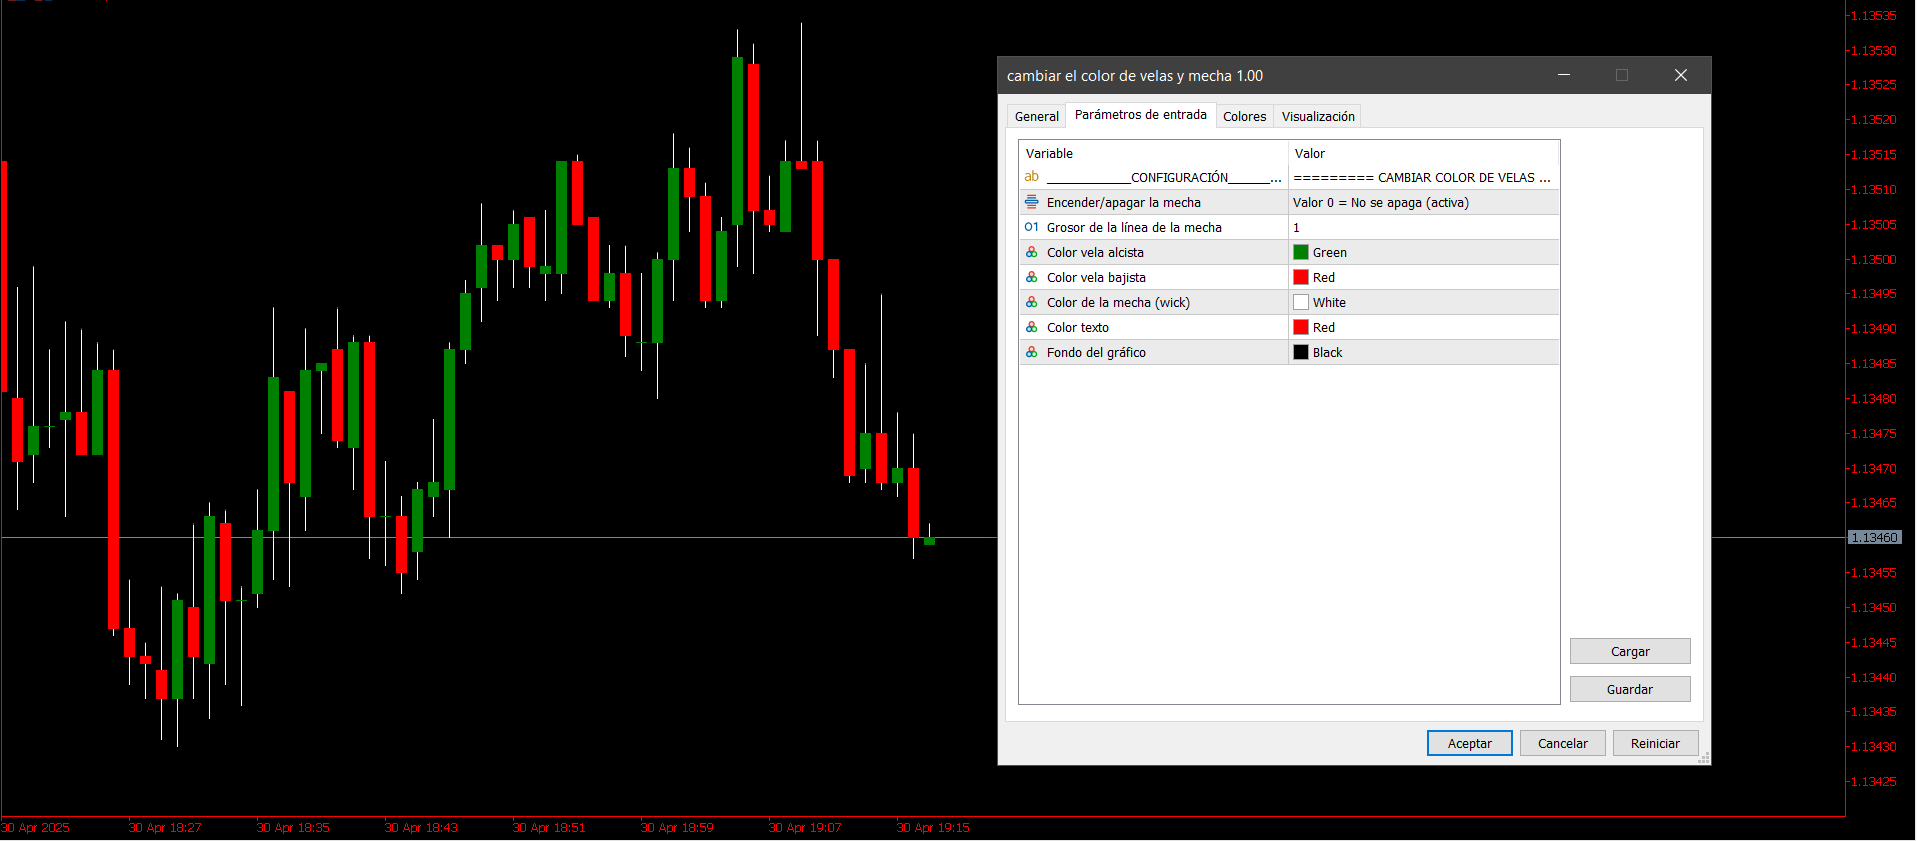
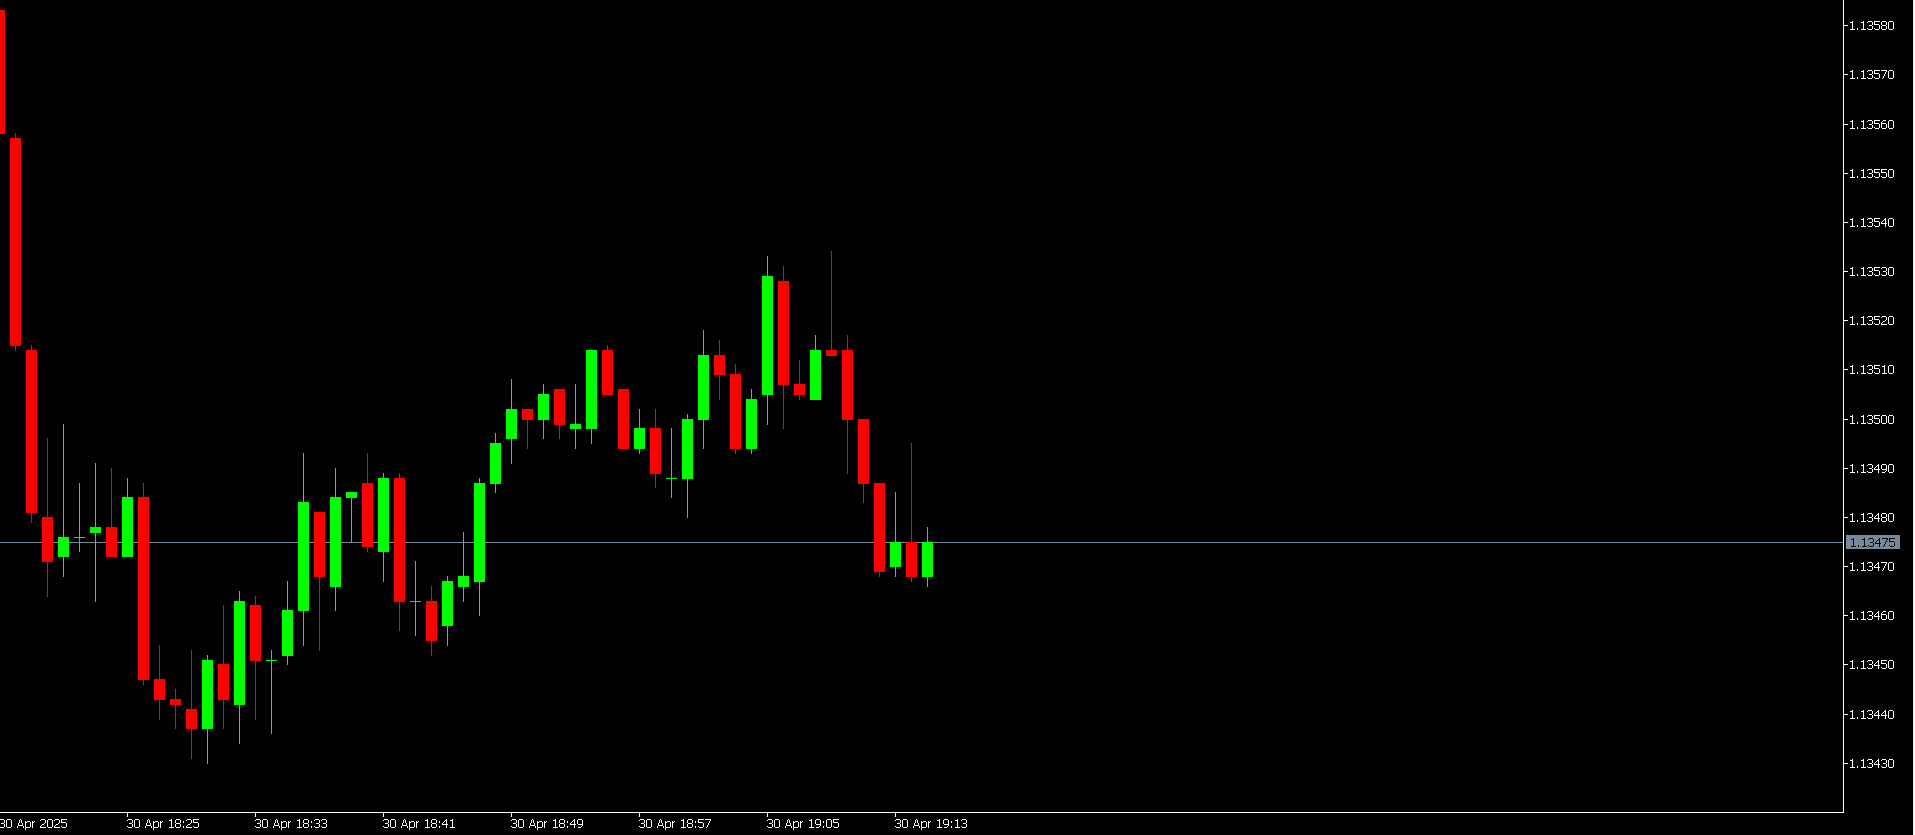
Draw the wicks (thin lines): Draw a vertical line from the lowest price to the highest price of each candle (this is called a "wick"). Draw the body of the candle: Draw a rectangle from the opening price to the closing price, using a different colour if the candle is bullish or bearish. Colour customisation: You can easily change the colours used for bullish and bearish candles and their wicks.
In the code you use, for example: The bearish candles have a maroon body (clrMaroon). The wicks of the bearish candles are light violet (clrOrchid). What is it useful for? This indicator is useful if you want to: Have a unique and clear visual style on your charts. Differentiate bullish candles more easily from bearish ones. Analyse the price behaviour in a more visual way.
Translated from Spanish by MetaQuotes Ltd.
Original code: https://www.mql5.com/es/code/58896
 Customised bmap chart
This is a custom indicator for MetaTrader 5 whose sole purpose is to display a BMP image on the chart, centred on the screen
 Triangular Arbitrage
This Expert Advisor (EA) implements a triangular arbitrage strategy between three currency pairs: EURUSD, USDJPY and EURJPY
Divergence DeMarker
This indicator picks up the divergence points of the DeMarker indicator
Indicator based on 2 MAs
Good afternoon everyone) First time posting my code!!!