Gayathiri Gopalakrishnan
  • MQL5 Developer | Expert Advisor & Indicator Developer in Independent MQL5 Developer
  • Indien
  • 2025
4.2 (11)
  • Information
1 Jahr
Erfahrung
12
Produkte
55
Demoversionen
0
Jobs
0
Signale
0
Abonnenten
MQL5 Developer | Expert Advisor & Indicator Developer in Independent MQL5 Developer
I am an independent MQL5 developer focused on creating practical trading tools for MetaTrader 5.
My work includes Expert Advisors, trading indicators, analytical tools and trading utilities designed to help traders analyze the market, manage trades and automate specific trading tasks.
What I focus on
MetaTrader 5 Expert Advisors
Custom trading indicators
Trading panels and utilities
Risk and trade-management tools
Strategy automation
Clear and practical user interfaces
My development approach
I focus on making products easy to understand and practical to use. Each product is designed with clear inputs, documentation and examples so that users can understand how the tool works before using it.
I continuously improve my products based on testing, updates and user feedback.
My Market Products
You can find my MetaTrader products on my MQL5 Market profile. Each product page contains its features, screenshots, usage information, settings and testing details.
Thank you for visiting my profile and exploring my work.
Gayathiri Gopalakrishnan
See What Is Happening Inside Every Candle — Footprint & Order Flow for MT5

A normal candlestick only shows Open, High, Low and Close.

But it does not tell you:

Who was aggressive at each price?
Where did buyers enter?
Where did sellers dominate?
Where was the highest trading activity?
Was the move supported by volume and delta?
Where are traders potentially trapped?

This Footprint / Order Flow Indicator is designed to reveal that information directly inside your MetaTrader 5 chart.

In the EURJPY M1 example shown above, the indicator breaks each candle into individual price levels and displays the trading activity occurring inside the candle.

🔍 What you are seeing in this chart

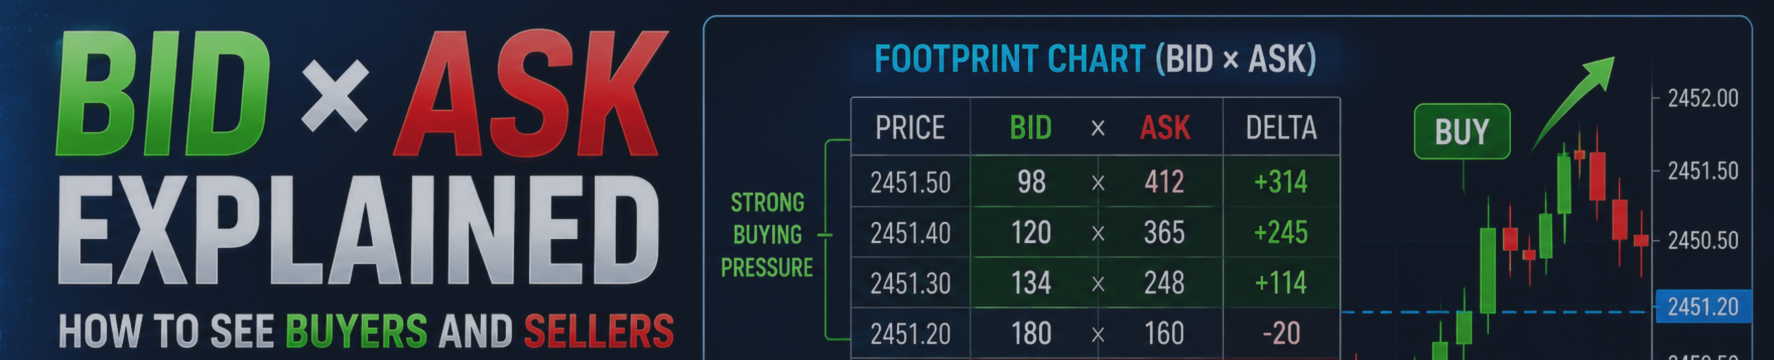
Each footprint cell represents activity at a specific price level.

Bid × Ask values help show the interaction between selling and buying activity.

🟢 Green areas highlight levels where buying activity is stronger.

🔴 Red areas highlight levels where selling activity is stronger.

The intensity of the shading helps you quickly identify where more activity occurred.

Instead of looking only at whether a candle closed green or red, you can study how that candle was actually created.

⚡ Imbalance Detection

One of the most useful parts of footprint analysis is identifying imbalances.

An imbalance occurs when activity on one side becomes significantly stronger than activity on the opposite side.

This can help identify areas where:

✅ aggressive buyers entered
✅ aggressive sellers entered
✅ momentum is increasing
✅ absorption may be occurring
✅ a breakout may have real participation behind it
✅ a move may be losing strength

Multiple imbalances appearing close together can provide valuable information about market pressure.

📦 Point of Control Inside the Candle

The boxed areas shown inside the footprint help highlight important activity levels within individual candles.

The Point of Control (POC) represents a price area with significant trading activity.

Watching how price reacts around these areas can help traders identify possible:

• support
• resistance
• continuation zones
• rejection areas
• breakout levels

📈 Delta — Understand Buyer vs Seller Pressure

At the bottom of the chart you can see Volume, Delta and Swing information for each candle.

Delta helps compare buying and selling pressure.

For example, the latest candle in the screenshot shows:

Volume: 34
Delta: +8
Delta percentage: +24%

A positive delta indicates stronger aggressive buying activity relative to selling activity within that candle.

At the top of the chart you can also see Cumulative Delta.

In this example:

Cumulative Delta: +31

This provides additional context about whether buying or selling pressure has been dominating across the analyzed sequence.

📊 Volume Profile — See Where the Market Is Doing Business

On the right side of the chart you can see the horizontal Volume Profile.

This makes it much easier to recognize prices where a large amount of activity has taken place.

Important levels displayed include:

POC — Point of Control
The price with strong concentration of activity.

VAH — Value Area High
Upper boundary of the important value area.

VAL — Value Area Low
Lower boundary of the important value area.

These levels can become very useful areas to monitor for reaction, rejection, acceptance and breakout behaviour.

💜 VWAP

The chart also displays VWAP — Volume Weighted Average Price.

VWAP gives additional context about where price is trading relative to the volume-weighted average.

It can help traders evaluate whether price is trading above, below or around an important average-value area.

🟠 Developing and Naked POC Levels

The chart also highlights levels such as dPOC and nPOC.

These levels can help identify prices where significant activity previously occurred and where the market may react again later.

Instead of manually searching through hundreds of candles, these important areas are shown directly on your MT5 chart.

🧠 Built-in Market Reading Information

Notice the message in the upper-left area of the screenshot:

“Buyers are lifting the ask (24% delta)”

The indicator is not simply filling the chart with numbers.

It organizes order-flow information so that traders can understand what is happening more quickly.

In this example it also identifies that:

Value is migrating upward
Pullbacks are being bought
Cumulative delta remains positive

But importantly, it still displays:

“No setup — waiting for a clean read.”

That is important.

The purpose is not to produce random BUY and SELL signals on every candle.

The purpose is to give traders more information about the internal structure of the market so they can make better-informed trading decisions.

🚀 Why use Footprint Charts instead of ordinary candles alone?

Traditional candlesticks show you the final result.

Footprint charts help you study what happened inside that result.

You can analyze:

✅ Bid × Ask activity
✅ Buyer and seller pressure
✅ Candle Delta
✅ Delta percentage
✅ Cumulative Delta
✅ Imbalances
✅ Volume concentration
✅ Candle POC
✅ Volume Profile
✅ VAH / VAL
✅ VWAP
✅ dPOC / nPOC
✅ Swing behaviour
✅ Absorption areas
✅ Potential trapped activity
✅ Market participation at individual price levels

This can be especially useful for traders interested in:

Scalping • Intraday Trading • Breakouts • Pullbacks • Support & Resistance • Order Flow • Volume Analysis • Market Structure

🎯 Stop Looking Only at the Candle — Look Inside It

If you have ever looked at a candlestick and wondered:

“Why did price reverse here?”

“Are buyers really strong?”

“Is this breakout supported by participation?”

“Where are buyers and sellers actually fighting?”

A footprint chart gives you another layer of information that a normal candlestick cannot show by itself.

Instead of trading only from the outside of the candle, start studying the activity inside the candle.

🔥 Get the Indicator for MetaTrader 5

Full product information, screenshots and access are available on the MQL5 Market:

👉 https://www.mql5.com/en/market/product/190942?source=Site+Market+My+Products+Page

See the market differently.
Understand the battle between buyers and sellers.
Trade with more information — not more guessing.
Gayathiri Gopalakrishnan
Beitrag GOLD BURGER EA for MT5: Complete Setup, Trading Logic, Order Flow and Risk Management Guide veröffentlicht
GOLD BURGER EA for MT5: Complete Setup, Trading Logic, Order Flow and Risk Management Guide https://www.mql5.com/en/market/product/164949?source=Site+Market+My+Products+Page GOLD BURGER is an automated Expert Advisor developed for MetaTrader 5...
Gayathiri Gopalakrishnan
https://www.mql5.com/en/market/product/195810?source=Site+Market+MT5+Search+Rating006%3aorder+flow+foot Footprint Charts in MT5: A Complete Beginner's Guide to Order Flow Trading https://www.mql5.com/en/market/product/195810...
Gayathiri Gopalakrishnan
https://www.mql5.com/en/market/product/195810?source=Site+Market+MT5+Search+Rating006%3aorder+flow+foot A candle tells you where price went. It does not tell you who moved it...
Gayathiri Gopalakrishnan Hat ein Produkt angeboten

78.00 USD

GOLD BURGER SCAN-MODUS EA https://www.mql5.com/en/blogs/post/774613 GOLD BURGER ist ein automatisierter Expert Advisor für MetaTrader 5, der darauf ausgelegt ist, Marktbedingungen zu analysieren, Handelsmöglichkeiten zu identifizieren und Trades automatisch zu verwalten. Der EA kombiniert Kursverläufe, Kerzenmuster, Marktstruktur, Chartbestätigung und Order-Flow-Analyse. Anstatt sich auf ein einziges Signal zu verlassen, wertet GOLD BURGER mehrere Marktbedingungen aus, bevor eine

Gayathiri Gopalakrishnan Hat ein Produkt angeboten

https://www.mql5.com/en/blogs/post/774611 Trade Copier Pro MT4/MT5 Trade Copier Pro MT4/MT5 ist eine professionelle Anwendung zum Kopieren von Trades, die für MetaTrader-Nutzer entwickelt wurde, die ihre Handelsaktivitäten zwischen mehreren Konten synchronisieren müssen. Das Produkt unterstützt das Kopieren von Trades zwischen MetaTrader 4 und MetaTrader 5 und ermöglicht so die Kommunikation zwischen MT4- und MT5-Terminals sowie innerhalb derselben Plattform. Es kann für das Kopieren von Trades

Gayathiri Gopalakrishnan Hat ein Produkt angeboten

https://www.mql5.com/en/blogs/post/774611 Trade Copier Pro MT4/MT5 Trade Copier Pro MT4/MT5 ist eine professionelle Anwendung zum Kopieren von Trades, die für MetaTrader-Nutzer entwickelt wurde, die ihre Handelsaktivitäten zwischen mehreren Konten synchronisieren möchten. Das Produkt unterstützt das Kopieren von Trades zwischen MetaTrader 4 und MetaTrader 5 und ermöglicht so die Kommunikation zwischen MT4- und MT5-Terminals sowie innerhalb derselben Plattform. Es kann für das Kopieren von Trades

Gayathiri Gopalakrishnan Hat ein Produkt angeboten

Willkommen beim Scalper Oscillator , einem MetaTrader 5-Indikator, der für Händler entwickelt wurde, die eine übersichtlichere und besser organisierte Methode zur Untersuchung kurzfristiger Marktbewegungen wünschen. Dieser Indikator vereint mehrere visuelle Elemente in einem Arbeitsbereich: Oszillator-Druck, Bullen- und Bären-Scoring, Signallinie, Chart-Zonen, Pfeile, Projektionsfläche, Referenz-SL- und TP-Levels sowie Dashboard-Informationen. Das Ziel ist es, Händlern zu helfen, das

Gayathiri Gopalakrishnan Hat ein Produkt angeboten
Bewertungen: 1
152.00 USD

PROP FIRM OS Strukturierter Handelsassistent für MetaTrader 5 PROP FIRM OS ist ein strukturierter Handelsassistent für MetaTrader 5 Nutzer, die regelbasierte Marktanalysen und organisierte Handelsabläufe bevorzugen. Der Expert Advisor kombiniert Marktanalyse-Tools, Scanner-Funktionen, Dashboard-Überwachung, Alarme, Risikokontroll-Einstellungen und Handelsmanagement-Funktionen in einem System. PROP FIRM OS wurde entwickelt, um Händlern zu helfen, ausgewählte Regeln, Filter und

12