Gayathiri Gopalakrishnan
  • MQL5 Developer | Expert Advisor & Indicator Developer 在 Independent MQL5 Developer
  • 印度
  • 2359
4.4 (15)
  • 信息
1 年
经验
15
产品
57
演示版
0
工作
0
信号
0
订阅者
MQL5 Developer | Expert Advisor & Indicator Developer 在 Independent MQL5 Developer
I am an independent MQL5 developer focused on creating practical trading tools for MetaTrader 5.
My work includes Expert Advisors, trading indicators, analytical tools and trading utilities designed to help traders analyze the market, manage trades and automate specific trading tasks.
What I focus on
MetaTrader 5 Expert Advisors
Custom trading indicators
Trading panels and utilities
Risk and trade-management tools
Strategy automation
Clear and practical user interfaces
My development approach
I focus on making products easy to understand and practical to use. Each product is designed with clear inputs, documentation and examples so that users can understand how the tool works before using it.
I continuously improve my products based on testing, updates and user feedback.
My Market Products
You can find my MetaTrader products on my MQL5 Market profile. Each product page contains its features, screenshots, usage information, settings and testing details.
Thank you for visiting my profile and exploring my work.
Gayathiri Gopalakrishnan 已发布产品
评论: 3
267.00 USD

XAUUSD - M1,M5,M15,M30 and H1 BTCUSD -  M1,M5,M15,M30 and H1 US30 -  M1,M5,M15,M30 and H1 OrderFlow Footprint Pro AutoTrader MT5 – Advanced Order Flow Trading EA, Footprint Analysis, Volume Delta and Automated Trading Discover Advanced Order Flow Trading with OrderFlow Footprint Pro AutoTrader OrderFlow Footprint Pro AutoTrader MT5 is an advanced MetaTrader 5 Expert Advisor designed for traders who want to study market activity at individual price levels, analyse buying and selling

Gayathiri Gopalakrishnan
Hi, thank you very much for spending time testing my **FootPrint Chart MT5** indicator and for explaining your questions clearly.

Please don’t worry if you currently understand only around 50% of the information shown on the chart. That is completely normal when you first start using a FootPrint chart.

A normal candlestick mainly tells you **where price opened, moved, and closed**.

A FootPrint chart gives you much more information about **what happened inside that candle between buyers and sellers**.

The important thing is that you do **not** need to understand every number immediately.

I will explain it below in very simple language, starting from the basics and then moving to the more advanced techniques.

---

# 1. First understand what the FootPrint is actually showing

Think of every candle as a small battle between two groups:

**BUYERS = people aggressively buying**

**SELLERS = people aggressively selling**

The FootPrint helps you look inside the candle and understand which side was more aggressive.

So instead of looking only at:

**“The candle is green, so buyers are strong.”**

you can ask:

**“Were buyers actually aggressive inside the candle?”**

And instead of:

**“The candle is red, so sellers are strong.”**

you can ask:

**“Did sellers really control the price, or were sellers getting absorbed by buyers?”**

That difference is extremely important.

---

# 2. The first three things you should learn

When you open the indicator, don’t try to read everything.

Start with only these three things:

### A. BUYER vs SELLER pressure

Look at whether buying or selling activity is stronger.

If buying pressure is consistently stronger, buyers are trying to push price upward.

If selling pressure is consistently stronger, sellers are trying to push price downward.

But remember:

**High buying volume does NOT automatically mean BUY.**

And:

**High selling volume does NOT automatically mean SELL.**

This is one of the most important things to understand.

Why?

Because sometimes aggressive buyers enter heavily, but price still cannot move higher.

That can mean someone is **absorbing those buyers**.

The same thing can happen with sellers.

This brings us to one of the most useful FootPrint concepts.

---

# 3. Hidden Trick #1 — High volume does not always mean continuation

This is one of the biggest mistakes beginners make.

Imagine Gold reaches resistance.

Suddenly, the FootPrint shows very strong BUY activity.

A beginner may think:

**“Wow, buyers are very strong. I should BUY.”**

But price does not move higher.

Instead, price stays at the same area.

Then selling begins.

That can indicate that large selling interest was waiting there and **absorbed the aggressive buyers**.

So the important question is not:

**“How much volume is there?”**

The better question is:

**“What did price do after that volume appeared?”**

If there is huge buying but almost no upward progress, be careful.

If there is huge selling but almost no downward progress, be careful.

This is called **absorption**.

---

# 4. Hidden Trick #2 — Watch the result, not only the numbers

This is a very powerful way to read FootPrint.

Suppose you see:

**Very strong selling**

but the candle refuses to go lower.

That is interesting.

Why?

Because sellers are working hard, but price is not responding in the same direction.

This can mean buyers are absorbing that selling.

Likewise:

**Very strong buying**

but price refuses to go higher.

That can mean sellers are absorbing the buying.

So always compare:

**Volume/pressure + Price movement**

Never look at volume alone.

---

# 5. How to identify a valid BUY setup

I recommend using a simple 4-step process.

### Step 1 — Find an important area

First locate a meaningful area on the chart.

For example:

**Support**

**Previous low**

**Strong reaction area**

**Liquidity area**

**Previous breakout area**

You should not start by looking for a BUY signal in the middle of nowhere.

Start with:

**“Where is price?”**

---

### Step 2 — Look at what sellers are doing

Suppose Gold reaches support.

You may see strong selling entering the market.

That alone does not mean SELL.

Watch what happens next.

If sellers continue aggressively but price cannot move significantly below support, that becomes interesting.

It suggests that selling may be getting absorbed.

---

### Step 3 — Look for buyers taking control

Now look for evidence that buyers are beginning to dominate.

For example:

Buying pressure increases.

The FootPrint begins showing stronger bullish activity.

Price stops making new lows.

A bullish rejection appears.

Price starts moving upward away from the support area.

Now the BUY idea becomes much stronger.

---

### Step 4 — Wait for confirmation

This is where many traders make mistakes.

They see absorption and immediately enter.

I prefer waiting for price confirmation.

For example:

**Support → selling appears → selling gets absorbed → buyers appear → price confirms upward movement**

Then look for the entry.

This reduces the chance of entering simply because one FootPrint number looked attractive.

---

# 6. BUY example — XAUUSD

Let’s use a simple example.

Suppose Gold is moving downward.

Price reaches:

**Support = 2650.00**

The FootPrint shows strong selling around that area.

But despite the strong selling, price does not continue falling.

Then buying activity starts increasing.

Price moves back above:

**2650.50**

For educational purposes, one possible trade structure could be:

**BUY Entry: 2650.50**

**Stop Loss: 2647.50**

**Take Profit: 2656.50**

Risk:

**3.00 points**

Potential reward:

**6.00 points**

Risk-to-reward:

**1 : 2**

The numbers above are only an example to explain the method. They are not a fixed Gold signal.

The important part is the sequence:

**Support**

↓

**Strong selling**

↓

**Selling gets absorbed**

↓

**Buyers begin taking control**

↓

**Price confirms**

↓

**BUY**

---

# 7. Where should the BUY Stop Loss go?

The SL should not simply be placed at an arbitrary number.

Ask:

**“At what price would my BUY idea become wrong?”**

Suppose your BUY idea is based on support.

Then the logical invalidation point is normally below the area that created the bullish setup.

For example:

Support = 2650.00

Your trade enters = 2650.50

If price falls strongly through the support and the bullish FootPrint setup completely fails, then your original idea is no longer valid.

The SL therefore belongs beyond the invalidation area, with enough room for normal Gold volatility.

This is much more logical than saying:

**“I always use a 20-point SL.”**

Gold does not move the same way every minute.

---

# 8. Where should the BUY Take Profit go?

Instead of selecting TP randomly, ask:

**“Where is price likely to face the next important obstacle?”**

That may be:

**Previous high**

**Resistance**

**Liquidity area**

**Another major reaction zone**

For example:

Entry = 2650.50

Next resistance = around 2656.50

Then that area may become a logical profit target.

This is why the FootPrint should be combined with normal market structure.

The FootPrint tells you about the **battle between buyers and sellers**.

Market structure tells you **where that battle is happening**.

Both are useful together.

---

# 9. How to identify a valid SELL setup

The SELL process is exactly the opposite.

### Step 1 — Find resistance

Look for:

**Resistance**

**Previous high**

**Strong rejection area**

**Liquidity area**

**Previous breakout area**

---

### Step 2 — Look at buyers

Suppose Gold reaches resistance.

Aggressive buyers start entering strongly.

Do not immediately BUY.

Watch the reaction.

If buyers are aggressive but price cannot continue higher, something important may be happening.

---

### Step 3 — Look for absorption

If large buying appears but price remains stuck at resistance, sellers may be absorbing those buyers.

Then selling activity may start increasing.

This can create a possible reversal setup.

---

### Step 4 — Wait for confirmation

For example:

**Resistance**

↓

**Strong buying**

↓

**Price cannot continue upward**

↓

**Buying gets absorbed**

↓

**Selling increases**

↓

**Price confirms downward movement**

↓

**SELL**

---

# 10. SELL example — XAUUSD

Suppose Gold reaches:

**Resistance = 2660.00**

Strong buying appears in the FootPrint.

But price cannot continue above the resistance.

Sellers begin appearing.

Price then moves back below:

**2658.50**

An educational example could be:

**SELL Entry: 2658.50**

**Stop Loss: 2661.50**

**Take Profit: 2652.50**

Again:

Risk = 3 points

Potential reward = 6 points

Risk-to-reward = 1 : 2

The important thing is not memorizing these numbers.

The important thing is understanding the sequence:

**Resistance**

↓

**Buyers become aggressive**

↓

**Buyers get absorbed**

↓

**Sellers take control**

↓

**Price confirms**

↓

**SELL**

---

# 11. Hidden Trick #3 — A signal at the right place is much more valuable than the same signal in the middle of the chart

This is extremely important.

Suppose you see bullish order flow.

Where is it?

If it appears directly at a major support area, it can be much more interesting.

If it appears randomly in the middle of a range, it may not be as meaningful.

The same bullish signal can therefore have completely different context depending on location.

Think like this:

**Signal + Location = Setup**

Not simply:

**Signal = Trade**

---

# 12. Hidden Trick #4 — Look for a change in control

One of the most useful things to watch is a **change from one side to the other**.

For example:

Initially:

**Sellers > Buyers**

Then:

**Sellers weaken**

Then:

**Buyers increase**

Then:

**Buyers > Sellers**

That change can be more informative than one isolated candle.

The opposite is true for SELL trades.

Watch for:

**Buyers > Sellers**

then

**Buyers weaken**

then

**Sellers increase**

then

**Sellers > Buyers**

That change in control is often worth watching carefully.

---

# 13. Hidden Trick #5 — Look at several consecutive FootPrint candles

Do not always judge a setup from one candle.

Sometimes one candle can contain unusual activity that does not continue.

Instead, watch a small sequence.

For example:

Candle 1:

Strong selling

Candle 2:

More selling

Candle 3:

Selling remains high but price stops falling

Candle 4:

Buyers become stronger

Candle 5:

Price moves upward

That sequence tells a much better story than looking at Candle 3 alone.

---

# 14. Hidden Trick #6 — Failed breakouts are very interesting

This is particularly useful on Gold.

Suppose Gold breaks above resistance.

At first, you might think:

**“Breakout = BUY.”**

But now check the FootPrint.

If buying activity is strong but Gold cannot continue higher, and price quickly falls back below the breakout level, that can be a **failed breakout**.

A failed breakout can provide useful reversal information.

The reverse is also true:

Price breaks below support.

Strong selling appears.

But sellers cannot continue pushing price lower.

Price then returns above support.

That failed breakdown can become a bullish setup.

This is one reason I recommend using FootPrint information together with price structure.

---

# 15. Hidden Trick #7 — POC / volume concentration can act as an important reference

Another useful concept is the area where a large amount of activity was concentrated.

Instead of looking at every individual FootPrint number, sometimes it is easier to ask:

**“Where did the market do the most business?”**

That area can become an important reference point.

When price returns to it, watch how buyers and sellers react.

Do not automatically buy or sell just because price reaches that level.

Use the FootPrint to see what is happening there.

---

# 16. Hidden Trick #8 — Compare the FootPrint with the candle itself

This is one of my favourite ways to teach FootPrint.

Look for situations such as:

### Situation A

Strong buying

Large bullish candle

Price moves higher

This is normal bullish continuation behaviour.

### Situation B

Strong buying

But very small price movement

Price cannot move higher

This deserves more attention because buyers may be getting absorbed.

### Situation C

Strong selling

Large bearish candle

Price moves lower

This is normal bearish continuation behaviour.

### Situation D

Strong selling

But price barely moves lower

That can indicate possible absorption by buyers.

This comparison can help you understand the chart much faster.

---

# 17. Which signals should an intermediate trader focus on?

You do NOT need to trade every signal shown by the indicator.

Initially, I suggest concentrating on these concepts:

**1. Imbalance**

Shows unusually strong pressure from one side.

**2. Absorption**

Strong aggressive activity appears, but price does not continue normally.

**3. Dominance**

Helps you understand which side is currently stronger.

**4. Rejection**

Price attempts to move through an area but gets rejected.

**5. Breakout / Failed breakout**

Helps identify continuation or possible reversal behaviour.

**6. Confirmation**

Wait for price to confirm what the FootPrint is showing.

Those six concepts are enough to start learning properly.

---

# 18. How I recommend using FootPrint for XAUUSD / Gold

Gold behaves differently from many Forex pairs because it can move very quickly.

Therefore, do not use the FootPrint as a standalone “BUY button” or “SELL button.”

For Gold, combine:

**Market structure**

*

**Support / Resistance**

*

**FootPrint order flow**

*

**Price confirmation**

This gives you a much clearer decision-making process.

The London and New York sessions are especially important because market activity can increase significantly during those periods.

Also be careful around major economic news.

Gold can move very aggressively during high-impact releases, so a FootPrint setup can change very quickly.

---

# 19. Recommended starting settings for Gold

There is no single setting that will be perfect for every trader.

The correct configuration can depend on:

**Broker**

**Gold symbol specification**

**Spread**

**Account type**

**Timeframe**

**Trading style**

As a starting point, I would recommend experimenting with the indicator on:

**M5**

**M15**

**M30**

For an intermediate trader, M15 or M30 can often be easier to study than extremely fast timeframes because there is less noise.

The most important thing is not finding a “magic setting.”

The goal is finding a configuration that gives you information clearly without overloading the chart.

---

# 20. A very simple way to use the indicator every day

When you open Gold, ask these questions in order:

### Question 1

**Where is price?**

Support?

Resistance?

Previous high/low?

Breakout area?

### Question 2

**Who is currently stronger?**

Buyers?

Sellers?

### Question 3

**Is there absorption?**

Are aggressive buyers/sellers failing to move price?

### Question 4

**Is there rejection?**

Did price try to break a level and fail?

### Question 5

**Did control change?**

Did buyers become sellers?

Or sellers become buyers?

### Question 6

**Has price confirmed the setup?**

Only after that should you consider the trade entry.

This simple process will make the FootPrint much easier to understand.

---

# 21. The biggest mistake to avoid

Please do not use the indicator like this:

**“Green = BUY”**

**“Red = SELL”**

**“Big number = BUY”**

**“Big number = SELL”**

That is not the correct way to understand order flow.

Instead, ask:

**Why is the volume large?**

**Where is it happening?**

**What did price do afterwards?**

**Who is getting absorbed?**

**Did control change?**

**Did price confirm?**

Those questions are much more powerful.

---

# 22. One complete BUY example

Let's simplify everything into one complete trade.

Gold reaches a known support area.

### Market

XAUUSD

### Location

Support zone

### FootPrint

Strong selling appears.

### Reaction

Price does not continue lower.

### Interpretation

Sellers may be getting absorbed.

### Next confirmation

Buying increases and price starts moving above the local confirmation level.

### Entry

Enter after bullish confirmation.

### Stop Loss

Place below the support/structure that would invalidate the BUY idea.

### Take Profit

Target the next important resistance or price objective.

### Trade logic

**Support**

→

**Selling**

→

**Absorption**

→

**Buyers take control**

→

**Confirmation**

→

**BUY**

---

# 23. One complete SELL example

Gold reaches a known resistance area.

### Market

XAUUSD

### Location

Resistance zone

### FootPrint

Strong buying appears.

### Reaction

Price cannot continue higher.

### Interpretation

Buyers may be getting absorbed.

### Next confirmation

Selling increases and price moves below the confirmation level.

### Entry

Enter after bearish confirmation.

### Stop Loss

Place above the resistance/structure that would invalidate the SELL idea.

### Take Profit

Target the next important support or price objective.

### Trade logic

**Resistance**

→

**Buying**

→

**Absorption**

→

**Sellers take control**

→

**Confirmation**

→

**SELL**

---

# 24. A very important point about Entry, SL and TP

The FootPrint should help you understand **why** a trade may make sense.

It should not encourage you to blindly enter at one fixed price on every setup.

For example:

Two BUY signals can appear.

BUY setup A:

Strong support + absorption + confirmation

BUY setup B:

Same bullish signal, but in the middle of a random range

The FootPrint information may look similar, but the context is completely different.

This is why experienced traders look at the **whole picture**.

---

# 25. How to learn the indicator faster

I recommend not trying to learn everything in one day.

For the first stage, learn only:

**Bid / Ask**

**Delta / pressure**

**Imbalance**

**Absorption**

**POC / volume concentration**

**Support and resistance**

Then practice identifying only:

**BUY at support**

and

**SELL at resistance**

After that becomes comfortable, start studying:

**Breakouts**

**Failed breakouts**

**Reversals**

**Continuation**

**Multi-timeframe confirmation**

This is much easier than trying to understand the entire chart at once.

---

# 26. The most important “hidden” idea

The biggest advantage of a FootPrint chart is not that it predicts the market.

Its real value is that it can help you see **the struggle between buyers and sellers more clearly**.

Candlestick:

**“Price went up.”**

FootPrint:

**“Price went up, and here is what buying and selling activity looked like while it happened.”**

That additional information can help you make more informed trading decisions.

The goal is therefore not:

**“Find one magic signal and enter every time.”**

The goal is:

**“Understand what buyers and sellers are doing and combine that information with market structure.”**

---

# 27. Final simple formula

For a BUY:

**Support**

*

**Selling gets absorbed**

*

**Buyers become stronger**

*

**Price confirms**

=

**Potential BUY setup**

For a SELL:

**Resistance**

*

**Buying gets absorbed**

*

**Sellers become stronger**

*

**Price confirms**

=

**Potential SELL setup**

Then:

**SL = invalidation level**

**TP = logical market target**

rather than simply using the same fixed SL/TP for every trade.

---

I have also attached a visual guide showing the FootPrint concepts together with a complete example BUY and SELL trade on XAUUSD. I strongly recommend keeping the image beside the MT5 chart while learning the indicator.

Once you understand these concepts, you will find that you do not need to read every single number on the FootPrint.

You only need to identify:

**WHERE is price?**

**WHO is stronger?**

**IS someone being absorbed?**

**DID control change?**

**HAS price confirmed?**

That is the foundation of reading FootPrint properly.

I hope this makes the FootPrint Chart much easier to understand.
Gayathiri Gopalakrishnan 已发布产品

LIVE SIGNAL Golden Brigade is an Expert Advisor for MetaTrader 5 designed for automated XAUUSD (Gold) trading on the M30 timeframe. The EA combines multiple technical conditions to evaluate market direction and potential trading opportunities. Its trading logic uses Murrey Math Channel levels together with BW-ZoneTrade and Gator-based analysis, along with candle and price conditions. Golden Brigade is intended for traders who want an automated approach to Gold trading without having to manually

Gayathiri Gopalakrishnan 已发布产品

156.00 USD

Liquidity DNA Liquidity DNA shows where large buy and sell orders are most likely waiting on your chart, and turns this into a clear trade plan: where to buy or sell, where to place the stop loss, and where to take profit, with the distance in pips for each level. It is made for manual traders who want to see the important price areas without studying complicated tools. Green boxes mark areas where buyers started strong moves before. Red boxes mark areas where sellers did. These zones are built

Gayathiri Gopalakrishnan
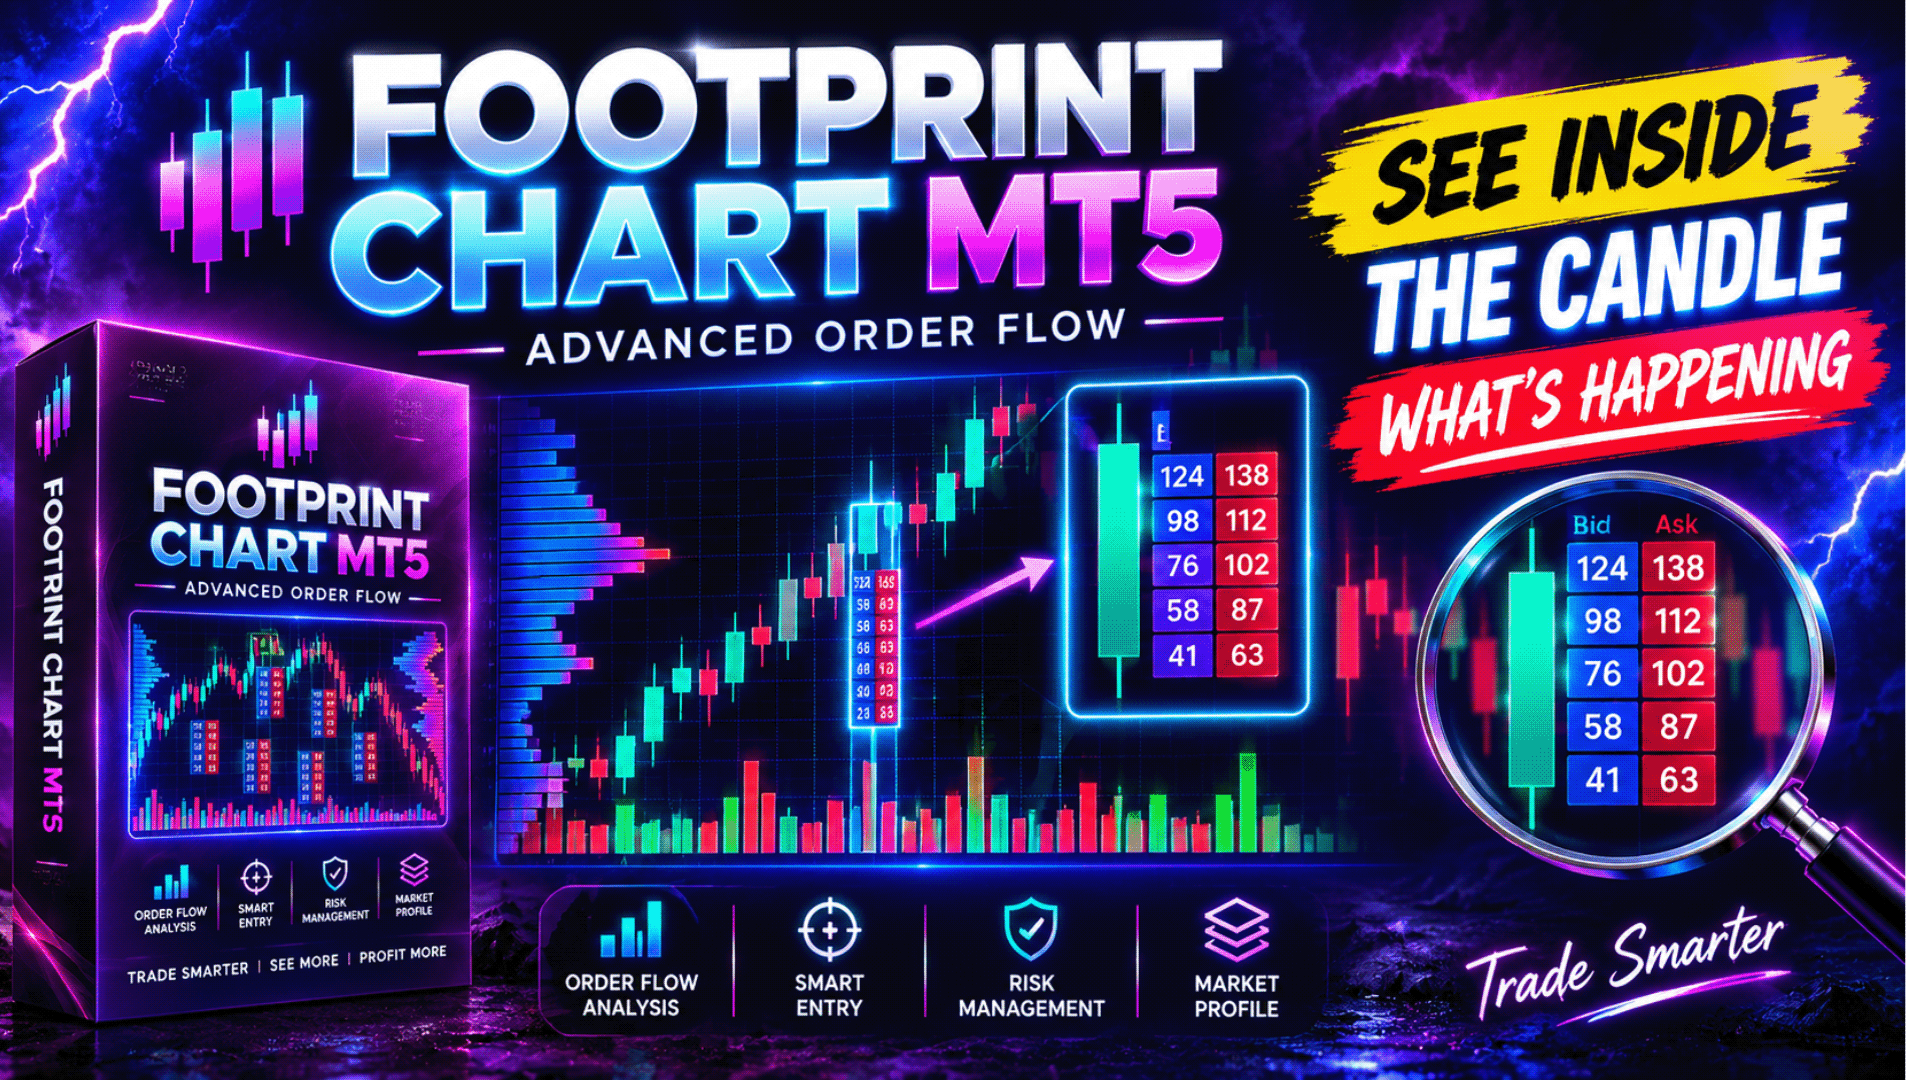
See What Is Happening Inside Every Candle — Footprint & Order Flow for MT5

A normal candlestick only shows Open, High, Low and Close.

But it does not tell you:

Who was aggressive at each price?
Where did buyers enter?
Where did sellers dominate?
Where was the highest trading activity?
Was the move supported by volume and delta?
Where are traders potentially trapped?

This Footprint / Order Flow Indicator is designed to reveal that information directly inside your MetaTrader 5 chart.

In the EURJPY M1 example shown above, the indicator breaks each candle into individual price levels and displays the trading activity occurring inside the candle.

🔍 What you are seeing in this chart

Each footprint cell represents activity at a specific price level.

Bid × Ask values help show the interaction between selling and buying activity.

🟢 Green areas highlight levels where buying activity is stronger.

🔴 Red areas highlight levels where selling activity is stronger.

The intensity of the shading helps you quickly identify where more activity occurred.

Instead of looking only at whether a candle closed green or red, you can study how that candle was actually created.

⚡ Imbalance Detection

One of the most useful parts of footprint analysis is identifying imbalances.

An imbalance occurs when activity on one side becomes significantly stronger than activity on the opposite side.

This can help identify areas where:

✅ aggressive buyers entered
✅ aggressive sellers entered
✅ momentum is increasing
✅ absorption may be occurring
✅ a breakout may have real participation behind it
✅ a move may be losing strength

Multiple imbalances appearing close together can provide valuable information about market pressure.

📦 Point of Control Inside the Candle

The boxed areas shown inside the footprint help highlight important activity levels within individual candles.

The Point of Control (POC) represents a price area with significant trading activity.

Watching how price reacts around these areas can help traders identify possible:

• support
• resistance
• continuation zones
• rejection areas
• breakout levels

📈 Delta — Understand Buyer vs Seller Pressure

At the bottom of the chart you can see Volume, Delta and Swing information for each candle.

Delta helps compare buying and selling pressure.

For example, the latest candle in the screenshot shows:

Volume: 34
Delta: +8
Delta percentage: +24%

A positive delta indicates stronger aggressive buying activity relative to selling activity within that candle.

At the top of the chart you can also see Cumulative Delta.

In this example:

Cumulative Delta: +31

This provides additional context about whether buying or selling pressure has been dominating across the analyzed sequence.

📊 Volume Profile — See Where the Market Is Doing Business

On the right side of the chart you can see the horizontal Volume Profile.

This makes it much easier to recognize prices where a large amount of activity has taken place.

Important levels displayed include:

POC — Point of Control
The price with strong concentration of activity.

VAH — Value Area High
Upper boundary of the important value area.

VAL — Value Area Low
Lower boundary of the important value area.

These levels can become very useful areas to monitor for reaction, rejection, acceptance and breakout behaviour.

💜 VWAP

The chart also displays VWAP — Volume Weighted Average Price.

VWAP gives additional context about where price is trading relative to the volume-weighted average.

It can help traders evaluate whether price is trading above, below or around an important average-value area.

🟠 Developing and Naked POC Levels

The chart also highlights levels such as dPOC and nPOC.

These levels can help identify prices where significant activity previously occurred and where the market may react again later.

Instead of manually searching through hundreds of candles, these important areas are shown directly on your MT5 chart.

🧠 Built-in Market Reading Information

Notice the message in the upper-left area of the screenshot:

“Buyers are lifting the ask (24% delta)”

The indicator is not simply filling the chart with numbers.

It organizes order-flow information so that traders can understand what is happening more quickly.

In this example it also identifies that:

Value is migrating upward
Pullbacks are being bought
Cumulative delta remains positive

But importantly, it still displays:

“No setup — waiting for a clean read.”

That is important.

The purpose is not to produce random BUY and SELL signals on every candle.

The purpose is to give traders more information about the internal structure of the market so they can make better-informed trading decisions.

🚀 Why use Footprint Charts instead of ordinary candles alone?

Traditional candlesticks show you the final result.

Footprint charts help you study what happened inside that result.

You can analyze:

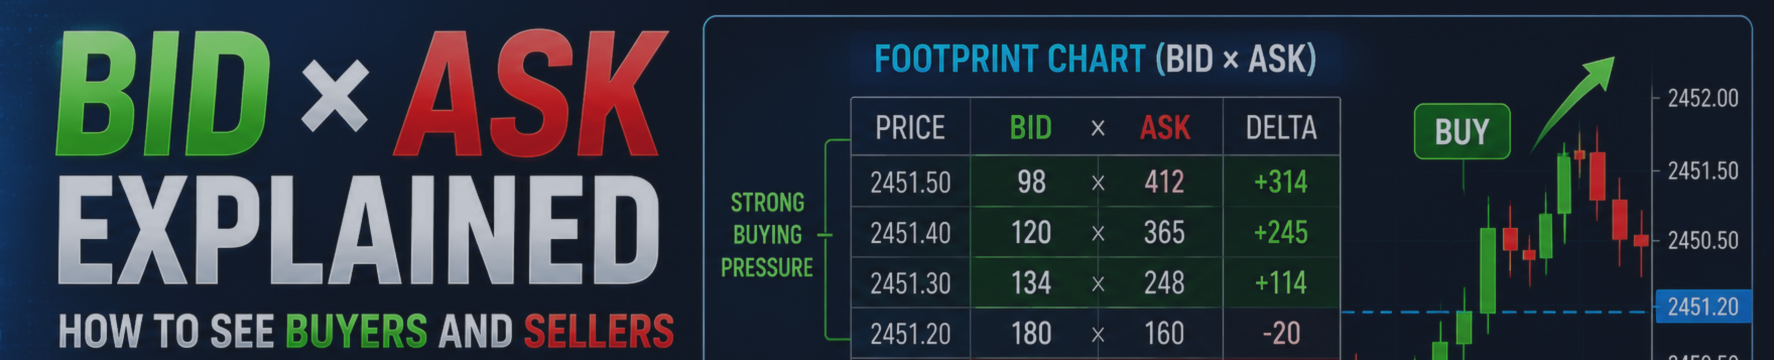
✅ Bid × Ask activity
✅ Buyer and seller pressure
✅ Candle Delta
✅ Delta percentage
✅ Cumulative Delta
✅ Imbalances
✅ Volume concentration
✅ Candle POC
✅ Volume Profile
✅ VAH / VAL
✅ VWAP
✅ dPOC / nPOC
✅ Swing behaviour
✅ Absorption areas
✅ Potential trapped activity
✅ Market participation at individual price levels

This can be especially useful for traders interested in:

Scalping • Intraday Trading • Breakouts • Pullbacks • Support & Resistance • Order Flow • Volume Analysis • Market Structure

🎯 Stop Looking Only at the Candle — Look Inside It

If you have ever looked at a candlestick and wondered:

“Why did price reverse here?”

“Are buyers really strong?”

“Is this breakout supported by participation?”

“Where are buyers and sellers actually fighting?”

A footprint chart gives you another layer of information that a normal candlestick cannot show by itself.

Instead of trading only from the outside of the candle, start studying the activity inside the candle.

🔥 Get the Indicator for MetaTrader 5

Full product information, screenshots and access are available on the MQL5 Market:

👉 https://www.mql5.com/en/market/product/190942?source=Site+Market+My+Products+Page

See the market differently.
Understand the battle between buyers and sellers.
Trade with more information — not more guessing.
Gayathiri Gopalakrishnan
已发布文章GOLD BURGER EA for MT5: Complete Setup, Trading Logic, Order Flow and Risk Management Guide
GOLD BURGER EA for MT5: Complete Setup, Trading Logic, Order Flow and Risk Management Guide https://www.mql5.com/en/market/product/164949?source=Site+Market+My+Products+Page GOLD BURGER is an automated Expert Advisor developed for MetaTrader 5...
Gayathiri Gopalakrishnan
https://www.mql5.com/en/market/product/190942?source=Site+Market+My+Products+Page Footprint Charts in MT5: A Complete Beginner's Guide to Order Flow Trading https://www.mql5.com/en/market/product/195810...
Gayathiri Gopalakrishnan
https://www.mql5.com/en/market/product/190942?source=Site+Market+My+Products+Page A candle tells you where price went. It does not tell you who moved it...
Gayathiri Gopalakrishnan 已发布产品
评论: 1
156.00 USD

Turn every candle into a bid x ask footprint built from real tick data. See who is actually trading at each price, with delta, volume profile, imbalance zones and a scored setup engine that prints entry, stop and target Order Flow Footprint Chart Pro Most indicators tell you what price did. This one tells you who did it. Order Flow Footprint Chart Pro rebuilds every candle on your chart from raw tick data and shows you the volume that traded at each individual price inside it, split into the

Gayathiri Gopalakrishnan 已发布产品

https://www.mql5.com/en/blogs/post/774611 Trade Copier Pro MT4/MT5 Trade Copier Pro MT4/MT5 is a professional trade copying application developed for MetaTrader users who need to synchronize trading activity between multiple accounts. The product supports trade copying between MetaTrader 4 and MetaTrader 5, allowing communication across MT4 and MT5 terminals as well as within the same platform. It can be used for MT4 to MT4, MT5 to MT5, MT4 to MT5 and MT5 to MT4 trade copying. The application is

Gayathiri Gopalakrishnan 已发布产品

https://www.mql5.com/en/blogs/post/774611 Trade Copier Pro MT4/MT5 Trade Copier Pro MT4/MT5 is a professional trade copying application developed for MetaTrader users who need to synchronize trading activity between multiple accounts. The product supports trade copying between MetaTrader 4 and MetaTrader 5, allowing communication across MT4 and MT5 terminals as well as within the same platform. It can be used for MT4 to MT4, MT5 to MT5, MT4 to MT5 and MT5 to MT4 trade copying. The application is

123