• Übersicht
  • Bewertungen (6)
  • Diskussion (3)
  • Neue Funktionen

Trend Line Map Pro MT5

5
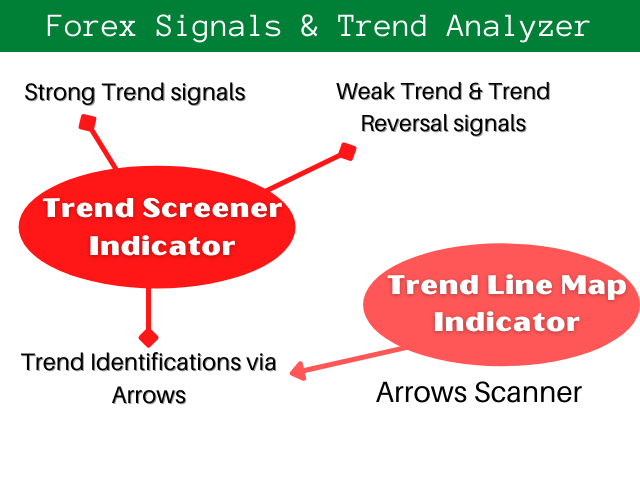
Trend Line Map Indicator ist ein Add-On für Trend Screener Indicator. Es arbeitet als Scanner für alle Signale, die vom Trendscreener (Trendliniensignale) erzeugt werden.

Es ist ein Trend Line Scanner basierend auf dem Trend Screener Indicator. Wenn Sie keinen Trend Screener Pro Indicator haben, funktioniert die Trend Line Map Pro nicht.

It's a Trend Line Scanner based on Trend Screener Indicator. If you don't have Trend Screener Pro Indicator,   the Trend Line Map Pro will not work.

Wenn Sie auf unseren MQL5-Blog zugreifen, können Sie die kostenlose Version des Trend Line Map-Indikators herunterladen. Probieren Sie es aus, bevor Sie es kaufen, ohne die Einschränkungen von Metatrader Tester. :  Klicken Sie hier


1. Vorteile, die Sie leicht bekommen

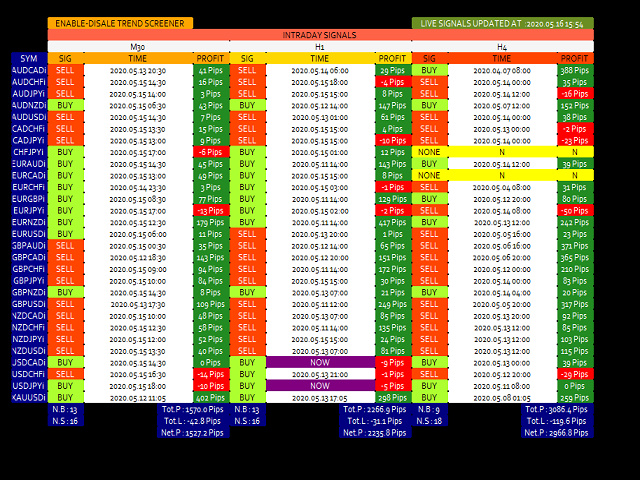
  • Zeigen Sie Kauf- und Verkaufssignale basierend auf Währungen und Zeitrahmen an.
  • Bewerten Sie, um wie viele Pips der Preis seit dem Erscheinen der Pfeile im Chart gestiegen oder gefallen ist. (Trend Screener Indikatoren Pfeile)
  • Zeigen Sie das Timing von Signalen an.
  • Erhalten eines Multi-Timeframe- und Multi-Währungs-Alerts zum Kauf und Verkauf von Alerts.

2. So verwenden Sie die Trendlinienkarte

Wie zeige ich das Dashboard für Kauf-Verkauf-Signale an?


Wenn Sie Fragen haben oder Hilfe benötigen, kontaktieren Sie mich per Privatnachricht.


Autor
SAYADI ACHREF , Fintech-Software-Ingenieur und Gründer von Finansya..
Bewertungen 6
T.J.Sch_318798
151
T.J.Sch_318798 2023.03.02 18:33 
 

This indicator is excellent. It greatly helps you to identify great teading oportunities & trend predictor helps correctly predict the trend and avoid traps. The service provided by Sayadi is amazing. This & trend predictor are excellent choice for having great - safe trading.

pdev
549
pdev 2023.02.06 08:35 
 

Great indicator and an indispensable add-on for trend screener indicator. Very helpful and responsive seller

Maungfortrading
229
Maungfortrading 2022.02.08 14:15 
 

Best Indicator !!

Empfohlene Produkte
Noize Absorption Index - is the manual trading system that measures the difference of pressure between bears forces and bulls forces. Green line - is a noize free index that showing curent situation. Zero value of index shows totally choppy/flat market.Values above zero level shows how powerfull bullish wave is and values below zero measures bearish forces.Up arrow appears on bearish market when it's ready to reverse, dn arrow appears on weak bullish market, as a result of reverse expectation.
199 USD
"The trend is your friend" is one of the best known sayings in investing, because capturing large trendy price movements can be extremely profitable. However, trading with the trend is often easier said than done, because many indicators are based on price reversals not trends. These aren't very effective at identifying trendy periods, or predicting whether trends will continue. We developed the Trendiness Index to help address this problem by indicating the strength and direction of price trend
49 USD
Laguerre SuperTrend Clouds   adds an Adaptive Laguerre averaging algorithm and alerts to the widely popular SuperTrend indicator. As the name suggests,   Laguerre SuperTrend Clouds (LSC)   is a trending indicator which works best in trendy (not choppy) markets. The SuperTrend is an extremely popular indicator for intraday and daily trading, and can be used on any timeframe. Incorporating Laguerre's equation to this can facilitate more robust trend detection and smoother filters. The LSC uses the
30 USD
Premium-Level ist ein einzigartiger Indikator mit mehr als 80% Genauigkeit der richtigen Vorhersagen! Dieser Indikator wurde von den besten Trading-Spezialisten seit mehr als zwei Monaten getestet! Den Indikator des Autors finden Sie nirgendwo anders! Anhand der Screenshots können Sie sich von der Genauigkeit dieses Tools überzeugen! 1 ist ideal für den Handel mit binären Optionen mit einer Ablaufzeit von 1 Kerze. 2 funktioniert bei allen Währungspaaren, Aktien, Rohstoffen, Kryptowähr
1 100 USD
Alpha Binary Pro
Rafael Alejandro Rey Alves
1 (1)
The Alpha Binary Pro indicator is intended to work in different scenarios. This indicator uses a combination of technical indicators to detect buy or sell opportunities. The indicator works with any currency pair, stocks, cryptocurrencies and synthetic indices. The indicated can be used for both traditional trading and binary options. The indicator works with any time frame, from M1 to MN. When the blue arrow is pointing upwards this indicates that the signal is to buy. When the red
30 USD
The Gann Box (or Gann Square) is a market analysis method based on the "Mathematical formula for market predictions" article by W.D. Gann. This indicator can plot three models of Squares: 90, 52(104), 144. There are six variants of grids and two variants of arcs. You can plot multiple squares on one chart simultaneously. Parameters Square — selection of a square model: 90 — square of 90 (or square of nine); 52 (104) — square of 52 (or 104); 144 — universal square of 144; 144 (full) — "full"
52 USD
Perfect Sniper
Ignacio Agustin Mene Franco
Perfect Sniper! is a triple indicator with support resistance detection, downtrend channel, uptrend channel Bands included! where he hunts the rebounds in the red lines for sale, in the green lines mark purchase, in the lower bands that are the breaks gives another second entry either buy or sell, perfect to take advantage of the double entrance, It is used in any temporality, It is used to scalp and long on h1 or h4 to D1. It works for Forex markets, All pairs. It is used for the synthetic inde
100 USD
Trend Fibonacci is a unique indicator that combines a power of Fibonacci sequences and ranges. How to read: - There are three zones --> red, gold and green - Red candlestick = downtrend - Green candlestick = uptrend   - Gold candlestick = no established trend Inputs: Per = number of bars used for calculations FirstRatio = first Fibonacci ratio (Or use any ratio you want) SecondRatio = second Fibonacci ratio (Or use any ratio you want) !! IF YOU PURCHASE THE INDICATOR, CONTACT ME FOR
47 USD
An indicator of pattern #31 ("Long Island") from Encyclopedia of Chart Patterns by Thomas N. Bulkowski. The second gap is in the opposite direction. Parameters: Alerts - show alert when an arrow appears   Push - send a push notification when an arrow appears (requires configuration in the terminal) GapSize - minimum gap size in points ArrowType - a symbol from 1 to 17 ArrowVShift - vertical shift of arrows in points   ShowLevels - show levels ColUp - color of an upward line ColDn - color of a
30 USD
Tunafish EA
Ismaele Daniele Lodetti
Tunafish EA is the most efficient EA on my profile. I spent a lot of time and effort to make this software sophisticated with possibilities of high potential returns while keeping the drawdown below 25%. The algorithms of the robot provide investors of any level of training with an investment opportunity that is both safe and aggressive. Tunafish EA imitating the work of the brain, capable of learning and adapting to changing conditions and predicting situations. When applied to trading in fina
69 USD
Dieser Indikator zeigt Ihnen die TP- und SL-Werte (in dieser Währung), die Sie bereits für jede Order in den Charts (geschlossen zur Transaktions-/Orderzeile) festgelegt haben, was Ihnen sehr dabei helfen wird, Ihren Gewinn und Verlust für jede Order zu schätzen. Und es zeigt Ihnen auch die PIPs-Werte. das angezeigte Format ist „Währungswerte unserer Gewinn- oder Verlust-/PIPs-Werte“. Der TP-Wert wird in grüner Farbe und der SL-Wert in roter Farbe angezeigt. Bei Fragen oder weiteren Informati
99 USD
This Indicator comes handy for everyone who uses Support and Resistance zones when trading. It will not only show you all major Supp/Res zones on the chart, but it will also notify you in a case of possible entry signal. Thanks to its customization possibilities, it will be the only indicator you will need when it comes down to trading Supp and Resistance zones.  !! If you decide to purchase the product, please contact me for further support and useful tips !! 
57 USD
SBA scalping v75
Umri Azkia Zulkarnaen
ini adalah indikator khusus digunakan untuk trading di binary.com dengan pair volatility 75. indikator ini sangat simpel dan mudah digunakan baik untuk yang sudah profesional atau pun yang baru dalam dunia trading terutama yang baru di market volatility 75.indikator ini lebih bertujuan untuk scalping trader dan menggunakan timeframe M1 sebagai acuan untuk entry. adapun jika ingin mempelajari lebih lanjut bisa menghubungi di telegram  https://t.me/shadowbreakerfx . untuk SOP lengkap silahkan klik
110 USD
Modified Rainbow
Rafael Alejandro Rey Alves
Modified Rainbow   The Modified Rainbow indicator is intended to work in different scenarios. The indicator uses a combination of technical indicators to detect buy or sell opportunities (different Moving Averages and other technical indicators). The indicator works with any currency pair, stocks, cryptocurrencies and synthetic indices. The indicator can be used for both traditional trading and binary options. The indicator works with any time frame, from M1 to MN. When the blue arrow
30 USD
Multi-timeframe trend indicator based on the ADX / ADXWilder indicator with Fibonacci levels The indicator shows trend areas using ADX or ADXWilder indicator data from multiple timeframes. The impulse mode of the indicator allows you to catch the beginning of a trend, and several "Screens" with different timeframes allow you to filter out market noise. Fibonacci levels are added to the price chart, which have flexible settings. How the indicator works: if PDI is greater than NDI, then   it`
35 USD
To get access to MT4 version please click here . - This is the exact conversion from TradingView: "Stochastic Momentum Index" By "UCSgears". - This is a popular version of stochastic oscillator on tradingview. - This is a light-load processing and non-repaint indicator. - Buffers are available for the lines on chart. - You can message in private chat for further changes you need. Thanks for downloading
40 USD
This MT5 indicator has been designed to be used on any currency pair and any time frame . It has the scalper and swing trader in mind.  The indicator looks for short-term high-probability reversals in price and will indicate to you to go long (buy) or short (sell) if you see a green or red arrow next to the current candlestick respectively. The indicator provides the best trading opportunities to you during the active trading hours of London and New York, but it will continue to give signals al
199 USD
Volality Index scalper indicator  Meant for Volality pairs such as Volality 10, 25, 50, 75 and 100 The indicator works on all timeframes from the 1 minute to the monthly timeframe the indicator is non repaint the indicator has 3 entry settings 1 color change on zero cross 2 color change on slope change 3 color change on signal line cross Orange line is your sell signal Blue line is your buy signal.
35 USD
Eine der Zahlenfolgen heißt „Forest Fire Sequence“. Es wurde als eine der schönsten neuen Sequenzen anerkannt. Sein Hauptmerkmal ist, dass diese Sequenz lineare Trends vermeidet, selbst die kürzesten. Diese Eigenschaft bildete die Grundlage dieses Indikators. Bei der Analyse einer Finanzzeitreihe versucht dieser Indikator, alle möglichen Trendoptionen abzulehnen. Und nur wenn er scheitert, dann erkennt er das Vorhandensein eines Trends und gibt das entsprechende Signal. Dieser Ansatz ermöglicht
30 USD
Rainbow EA MT5
Jamal El Alama
Description : Rainbow EA MT5 is a simple Expert advisor based on   Rainbow MT5 indicator witch is based on Moving average with period 34. The indicator is incorporated in the EA, therefore, it is not required for the EA to operate, but if you wish, you can download it from   my product page . The Expert Advisor settings are as follows : Suitable for Timeframes up to H1 The parameters below can be set according to your trading rules. StopLoss ( Stop Loss in pips) TakeProfit ( Take Profit in pi
59 USD
Candlestick Pattern Scanner is a multi-timeframe and multi-symbol dashboard and alert system that checks all timeframes and currency pairs for different candlestick patterns that are formed in them. Scanner is integrated   with support and resistance zones so you can check the candlestick patterns in most important areas of the chart to find breakout and reversal patterns in the price chart. Download demo version   (works on M4,M5,M6,M12,H3,H8 timeframes) Read the full description of scanner par
60 USD
The best time to trade Using this Indicator is when the time reach exactly hour,half,45 minutes,15 minutes and sometimes 5 minutes.. This indicators is helpful to those who trade boom and crash indecies.How to read this indicator first you'll see Blue allow and Red allow all these allows used to indicate or to detect the spike which will happen so the allow happens soon before the spike happen.This indicator works properly only in boom and crash trading thing which you have to consider when
30 USD
Your Trend Friend
Luigi Nunes Labigalini
The trend is your friend! Look at the color of the indicator and trade on that direction. It does not  repaint. After each candle is closed, that's the color of the trend. You can focus on shorter faster trends or major trends, just test what's most suitable for the symbol and timeframe you trade. Simply change the "Length" parameter and the indicator will automatically adapt. You can also change the color, thickness and style of the lines. Download and give it a try! There are big movements
99 USD
Renko Gold
Ignacio Agustin Mene Franco
Renko Gold! clearly indicates the floors and ceilings where it goes from 4 lines, the line below that marks the floor in green confirming with the thinnest line clarifies the purchase entry, the same is for sale, the top line marks the ceiling and the thinnest red line marks the sale, This indicator works for all temporalities! For Forex and Synthetic Indices markets! It also works for crypto markets! Good profit! World Investor.
40 USD
Trendseite - ein technischer Indikator zur Bestimmung des Trends. Es ist eine Reihe von mehreren vollwertigen Handelsstrategien. Der Indikator verwendet ein fortschrittliches Trendfiltersystem, hat ein statistisches Panel, berechnet Einstiegs- und Ausstiegsniveaus und berechnet das dynamische Trailing-Stop-Niveau. Geeignet für jede Art von Symbolen, zeichnet seine Signale und Ergebnisse niemals neu. Ein umfassendes Tool für den professionellen Trendhandel. Das Set des Trend Side-Indikators um
50 USD
Pipfinite creates unique, high quality and affordable trading tools. Our tools may or may not work for you, so we strongly suggest to try the Demo Version for MT4 first. Please test the indicator prior to purchasing to determine if it works for you. We want your good reviews, so hurry up and test it for free...we hope you will find it useful. Combo Energy Beam with Swing Control Strategy: Confirm swing pullback signals Watch Video: (Click Here) Energy Beam with Trend Laser Strategy: Confirm Tr
88 USD
Automatic fibonacci with alerts is an indicator that automatically plots a fibonacci retracement based on the number of bars you select on the BarsToScan setting in the indicator. The fibonacci is automatically updated in real time as new highest and lowest values appear amongst the selected bars. You can select which level values to be displayed in the indicator settings. You can also select the color of the levels thus enabling the trader to be able to attach the indicator several times with d
30 USD
Dies ist ein MTF-Indikator für Unterstützungs- und Widerstandsniveaus basierend auf den   Extremwerten des Advanced ZigZag Dynamic   und/oder   Extended Fractal   Indikators mit Preisetiketten (kann deaktiviert werden). Für den MTF-Modus können höhere TFs ausgewählt werden. Standardmäßig werden die Ebenen basierend auf ZigZag-Indikatorpunkten generiert. Fraktale Indikatorpunkte können auch zusammen mit ZigZag oder stattdessen verwendet werden. Um die Verwendung zu vereinfachen und CPU-Zeit zu sp
30 USD
Magic Finger can help you identify trends and trading opportunities clearly. The finger points to the open position signal, and the discoloration line is confirmed by the trend. If you are a day trader, you can choose to trade during a period of active trading, referring to the discoloration line as the basis for the next order, finger signal as a filter. If you are a trend trader, you can choose a period above H1, wait for the appearance of the finger signal in the key price area, and enter
188 USD
No Demand No Supply MT5
Panagiotis Diamantopoulos
No Demand No Supply   This indicator identifies   No Demand –No Supply candles  to your chart and plots volume bars colored according to the signal. It can be applied to all timeframes or to a specific one only. It can also be used as regular volume indicator  with exceptional future of WEIGHTED VOLUME. Furthermore is has an alert notification, sound and email when a signals occurs. The indicator does not repaint but the alert will come on two candles back due to the definition of No Demand No S
80 USD
Käufer dieses Produkts erwarben auch
ICT, SMC, SMART MONEY CONCEPTS, SMART MONEY, Smart Money Concept, Support and Resistance, Trend Analysis, Price Action, Market Structure, Order Blocks, BOS/CHoCH,   Momentum Shift, HH/LL/HL/LH,    Fair Value Gap, FVG,  Premium  &   Discount   Zones, Fibonacci Retracement, OTE, Buy Side Liquidity, Sell Side Liquidity, BSL/SSL Taken, Equal Highs & Lows, MTF, Multiple Time Frame, BigBar, HTF OB, HTF Market Structure,  Liquidity Voids, Long Wicks, Candle Timer, Fractals, ZigZag, Time Zone, Market S
63 USD
Dies ist ein Indikator für MT5, der genaue Signale für den Einstieg in einen Handel ohne Repainting (Neuzeichnen) liefert. Er kann auf alle Finanzwerte angewendet werden: Forex, Kryptowährungen, Metalle, Aktien, Indizes. Er liefert ziemlich genaue Schätzungen und sagt Ihnen, wann es am besten ist, eine Position zu eröffnen und zu schließen. Sehen Sie sich das Video (6:22) mit einem Beispiel für die Verarbeitung nur eines Signals an, das sich für den Indikator gelohnt hat! Die meisten Händler ver
125 USD
Advanced Supply Demand MT5
Bernhard Schweigert
4.36 (11)
Derzeit 33% Rabatt! Die beste Lösung für jeden Anfänger oder erfahrenen Händler! Dieser Indikator ist ein einzigartiges, qualitativ hochwertiges und erschwingliches Trading-Tool, da wir eine Reihe von proprietären Funktionen und eine neue Formel integriert haben. Mit diesem Update werden Sie in der Lage sein, doppelte Zeitrahmenzonen anzuzeigen. Sie können nicht nur einen höheren TF (Zeitrahmen) anzeigen, sondern sowohl den Chart-TF als auch den höheren TF: SHOWING NESTED ZONES. Alle Supply Dema
199 USD
Matrix Arrow Indicator MT5
Juvenille Emperor Limited
5 (11)
Matrix Arrow Indicator MT5   ist ein einzigartiger 10-in-1-Trend, der zu   100 % nicht neu gezeichnet   werden kann. Multi-Timeframe-Indikator, der für alle Symbole/Instrumente verwendet werden kann:   Forex ,   Rohstoffe ,   Kryptowährungen ,   Indizes ,   Aktien .  Der  Matrix Arrow Indicator MT5  wird den aktuellen Trend in seinen frühen Stadien bestimmen und Informationen und Daten von bis zu 10 Standardindikatoren sammeln, die sind: Durchschnittlicher Richtungsbewegungsindex (ADX) Rohstoff
75 USD
Royal Wave Pro M5
Vahidreza Heidar Gholami
5 (2)
Royal Wave is a Trend-Power oscillator which has been programmed to locate and signal low-risk entry and exit zones. Its core algorithm statistically analyzes the market and generates trading signals for overbought, oversold and low volatile areas. By using a well-designed alerting system, this indicator makes it easier to make proper decisions regarding where to enter and where to exit trades. Features Trend-Power Algorithm Low risk Entry Zones and Exit Zones Predictions for Overbought and Over
129 USD
Blahtech Supply Demand MT5
Blahtech Limited
4.45 (11)
Supply Demand uses previous price action to identify potential imbalances between buyers and sellers. The key is to identify the better odds zones, not just the untouched ones. Blahtech Supply Demand indicator delivers functionality previously unavailable on any trading platform. This 4-in-1 indicator not only highlights the higher probability zones using a multi-criteria strength engine, but also combines it with multi-timeframe trend analysis, previously confirmed swings and engulfing detecto
142 USD
AW Trend Predictor MT5
Alexander Nechaev
5 (23)
Die Kombination von Trend- und Aufschlüsselungsebenen in einem System. Ein fortschrittlicher Indikatoralgorithmus filtert Marktrauschen, bestimmt den Trend, Einstiegspunkte sowie mögliche Ausstiegsniveaus. Indikatorsignale werden in einem Statistikmodul aufgezeichnet, das es Ihnen ermöglicht, die am besten geeigneten Tools auszuwählen, die die Wirksamkeit der Signalhistorie zeigen. Der Indikator berechnet Take-Profit- und Stop-Loss-Marken. Handbuch und Anleitung ->   HIER   / MT4-Version ->   H
55 USD
Owl Smart Levels MT5
Sergey Ermolov
5 (1)
Indikator-Leitfaden  |  Owl Smart Levels-Strategie  |   MT4-Version  |  Wie installiert man?   |   FAQ Der Owl Smart Levels Indikator ist ein komplettes Handelssystem innerhalb eines Indikators, der so beliebte Marktanalysetools wie die fortschrittlichen Fraktale von Bill Williams , Valable ZigZag, das die richtige Wellenstruktur des Marktes aufbaut, und Fibonacci-Levels , die die genauen Einstiegslevels markieren, enthält in den Markt und Orte, um Gewinne mitzunehmen. 7 tage Promotion - bis zu
99 USD
Royal Scalping Indicator M5
Vahidreza Heidar Gholami
5 (8)
Royal Scalping Indicator is an advanced price adaptive indicator designed to generate high-quality trading signals. Built-in multi-timeframe and multi-currency capabilities make it even more powerful to have configurations based on different symbols and timeframes. This indicator is perfect for scalp trades as well as swing trades. Royal Scalping is not just an indicator, but a trading strategy itself. Features Price Adaptive Trend Detector Algorithm Multi-Timeframe and Multi-Currency Trend Low
149 USD
Offer 249 down from 350 for the next 3 copies. then back to 350 $ Are you tired of using outdated indicators that leave you guessing where to set your profit targets? Look no further than the AK CAP Opening Range Breakout Indicator. This powerful tool is backed by a US patent and has already helped countless traders pass funded challenges like FTMO. We use it daily on our prop traders and internal funds, and now it's available to you as well. The calculation behind the indicator is incredibly
249 USD
Stargogs Spike Catcher
Lorenzo Edward Beukes
5 (6)
Stargogs Spike Catcher V3 This Indicator is Developed To milk the BOOM and CRASH indices . Send me Message if you need any help with the indicator.  CHECK OUT THE STARGOGS SPIKE CATCHER EA/ROBOT V3: CLICK HERE ALSO CHECK OUT SECOND TO NONEFX SPIKE CATCHER:   CLICK HERE STARGOGS SPIKE CATCHER V3 WHATS NEW! Brand New Strategy. This is the Indicator you need for 2023. The Indicator Gives you an Entry at a time when conditions are met and you should use TP & SL. New Trendline that changes color in
100 USD
Italo Volume Indicator MT5
Italo Santana Gomes
5 (9)
BUY INDICATOR AND GET EA FOR FREE AS A BONUS + SOME OTHER GIFTS! ITALO VOLUME INDICATOR  is the best volume indicator ever created, and why is that? The Indicator works on all time-frames and assets, indicator built after 6 years of experience on forex and many other markets. You know many volume indicators around the internet are not complete, does not help, and it's difficult to trade, but the Italo Volume Indicator is different , the Italo Volume Indicator shows the wave volume, when market
65 USD
Sind Sie es leid, Unterstützungs- und Widerstandslinien zu zeichnen? Der Unterstützungswiderstand ist ein Multi-Zeitrahmen-Indikator, der Unterstützungs- und Widerstandslinien mit einer sehr interessanten Wendung automatisch erkennt und zeichnet: Wenn das Preisniveau im Laufe der Zeit getestet wird und seine Bedeutung zunimmt, werden die Linien dicker und dunkler. [ Installationsanleitung | Update-Anleitung | Fehlerbehebung | FAQ | Alle Produkte ] Steigern Sie Ihre technische Analyse über Nacht
99 USD
Market Profile defines a number of day types that can help the trader to determine market behaviour. A key feature is the Value Area, representing the range of price action where 70% of trading took place. Understanding the Value Area can give traders valuable insight into market direction and establish the higher odds trade. It is an excellent addition to any system you may be using. Blahtech Limited presents their Market Profile indicator for the MetaTrader community. Inspired by Jim Dalton’s
142 USD
Der Forex TPA Indikator deckt die wahren Aktionen der Marktmacher auf, immer dann wenn sie passieren. "Kämpfe nicht gegen die Marktmacher an, sondern folge ihnen", ist wohl der beste Rat, den ein Trader bekommen kann. Der TPA Indikator zeigt jedesmal seine Signale an wenn die Bullen definitiv stärker sind als die Bären und umgekehrt. Dieser Indikator wurde VON Tradern FÜR Trader gemacht und ist 100% NICHT NACHZEICHNEND! Signale werden STRENG am Schluss einer Kerze  generiert. Das sagen unsere Ku
168 USD
MACD Intraday Trend PRO ist ein Indikator, der durch eine Adaption des ursprünglichen MACD von Gerald Appel in den 1960er Jahren entwickelt wurde. Im Laufe der Jahre des Handels wurde beobachtet, dass wir durch die Änderung der Parameter des MACD mit Fibonacci-Proportionen eine bessere Darstellung der Kontinuität der Trendbewegungen erreichen, wodurch es möglich ist, den Beginn und das Ende eines Preistrends effizienter zu erkennen. Aufgrund seiner Effizienz bei der Erkennung von Kurstrends
77 USD
Wolfe Waves sind natürlich vorkommende Handelsmuster, die an allen Finanzmärkten vorhanden sind und einen Kampf um einen Gleichgewichtspreis darstellen. Diese Muster können sich über kurze und lange Zeiträume entwickeln und sind eines der zuverlässigsten prädiktiven Umkehrmuster, die es gibt und die normalerweise starken und langen Kursbewegungen vorausgehen. [ Installationsanleitung | Update-Anleitung | Fehlerbehebung | FAQ | Alle Produkte ] Klare Handelssignale Erstaunlich einfach zu handeln
99 USD
Relative Cyclicality
Cristian Mihail Pauna
The Relative Cyclicality indicator defines the cycles of any price evolution. This indicator is computed by applying the "Cyclicality" mathematical transformation to the classic Relative Strength Index indicator made by J. Welles Wilder. The Relative Cyclicality defines very good entry and exit trading signals near the minimal and maximal points. It is better than RSI itself due to the unicity of the minimal and maximal points on a specific time interval. The Relative Cyclicality indicator can b
300 USD
Price Cyclicality MT5
Cristian Mihail Pauna
The Price Cyclicality indicator defines the cycles of any price evolution. It shows clearly the ascending and descending intervals with asymptotic evolution near the minimal and maximal price values. The Price Cyclicality indicator can be used to generate automated entry signals near the minimal price values. Also, the Price Cyclicality indicator can be used to define limit conditions to generate automated exit signals near the maximal price values. The efficiency of this indicator was proved du
300 USD
Eazy Indicator
Isaac Agyei Poku
Forex BUY and SELL signals from the best Heiken Ashi Smoothed indicator. Draw bullish/bearish bars on the chart. Accurate trend detector. Heiken Ashi Smoothed is a simple MT5 indicator that draws bullish and bearish bars in the chart to reflect the direction of the trend. The indicator consists of orange bearish bars and green bullish bars. When the trend changes its direction, the indicator changes its color. The indicator is a modernization of the traditional Heiken Ashi indicator. Moving Aver
900 USD
Dieser Indikator ist ein perfekter automatischer Wellenanalyse-Indikator für den praktischen Handel! Die standardisierte Definition des Bandes ist nicht mehr eine Welle von verschiedenen Leuten, und das Ziehen von menschengemachten Interferenzen wird eliminiert, was eine Schlüsselrolle bei der gründlichen Analyse des Ansatzes spielt. =>Increase the choice of international style mode, (red fall green rise style)           Derzeit Kaufrabatt!   Inhalt des Index: 1.       Grundwelle:   Zue
188 USD
The signal conditions are a combination of three indicators, and XQ Forex Indicators only display  medium and long-term trends . The indicator's efficacy has been improved with the addition of a filter that blocks out false signals. The XQ Forex Indicator can be used on   FX pairs, CFDs, and Cryptocurrencies . There are two type of signals:  Buy or Sell and Big Long or Big Short It is possible to enable sending emails when a major trend-change signal is detected, as well as to display the alerts
199 USD
Italo Trend Indicator MT5
Italo Santana Gomes
4.75 (4)
BUY INDICATOR AND GET EA FOR FREE AS A BONUS + SOME OTHER GIFTS! ITALO TREND INDICATOR  is the best trend indicator on the market, the Indicator works on all time-frames and assets, indicator built after 6 years of experience on forex and many other markets. You know many trend indicators around the internet are not complete, does not help, and it's difficult to trade, but the Italo Trend Indicator is different , the Italo Trend Indicator shows the signal to buy or sell, to confirm the signal t
65 USD
Predictor PRO MT5
Evgenii Aksenov
5 (1)
A new generation progressive indicator from INFINITY. Predictor PRO uses its own entry and exit calculation strategy. Indicator without redrawing signals! This is very important for real trading. The indicator can be used for any currency pairs, metals, cryptocurrencies or indices. The best time of the H1 chart. Unlike other indicators, Predictor PRO shows shows the Buy/Sell entry point and the Close exit point. Calculating the profit of all signals in points on the panel helps to choose th
75 USD
Pivot Prof
Paul Anscombe
4.98 (43)
Our 5 Star Best Seller Beginner or Professional our best selling multi-timeframe Pivot Prof will enhance your trading and bring you great trade opportunities with the Support and Resistance levels that professionals use. Pivot trading is a simple effective method for entering and exiting the market at key levels and has been used by professionals for decades and works on all symbols: Forex, Crypto, Stocks, Indicies etc. Pivot Prof brings premium levels to the trader where the market is most like
69 USD
The Volume by Price Indicator for MetaTrader 5 features Volume Profile and Market Profile TPO (Time Price Opportunity). Get valuable insights out of currencies, equities and commodities data. Gain an edge trading financial markets. Highest quality real-time and historical price data distributions. Versatile range selection methods. Drag and drop with time/price option. Unlimited segmentation. Session filtering with built-in presets for New York, London, Tokyo, Sydney and São Paulo. Composites w
149.95 USD
PZ Trend Trading MT5
PZ TRADING SLU
3.25 (4)
Trend Trading ist ein Indikator, der so weit wie möglich von den Markttrends profitiert, indem er Pullbacks und Breakouts zeitlich festlegt. Sie findet Handelsmöglichkeiten, indem sie analysiert, was der Preis während etablierter Trends tut. [ Installationsanleitung | Update-Anleitung | Fehlerbehebung | FAQ | Alle Produkte ] Handeln Sie mit Zuversicht und Effizienz an den Finanzmärkten Profitieren Sie von etablierten Trends, ohne ins Wanken zu geraten Profitable Pullbacks, Ausbrüche und vor
125 USD
Auto Order Block with break of structure Detect Break of Structure , Mark Order Block and draw Entry / Stop and Risk to Reward lines when Order block is touch by price with Alert. Trend is Manually set to filter signals in a direction by a button on the chart. Entry / Stop and Risk to Reward lines can also be switch on / off by button on chart. Futures Auto Mark Break of Structure Auto Mark Order block Auto Mark higher time frame Point Of  Interest ( POI ) Popup Alert when BoS , Order block
55 USD
"The Squeeze indicator attempts to identify periods of consolidation in a market. In general the market is either in a period of quiet consolidation or vertical price discovery. By identifying these calm periods, we have a better opportunity of getting into trades with the potential for larger moves. Once a market enters into a "squeeze," we watch the overall market momentum to help forecast the market direction and await a release of market energy." The Modified TTM Squeeze Indicator is a modi
149 USD
Trading has never been so easy. The "Mega Spike Zone" is a real hunter when it comes to hunting for the famous spikes in the synthetic "boom and crash" indices. 1-The spike hunter can be used at any market time. 2-The spike hunter can be custom colored. 3-The spike hunter can be combined with the boom and crash products in my store. "If you don't execute all the signals of the trading system, don't expect to get the results of the system." (Perry Kaufman).
69 USD
Weitere Produkte dieses Autors
Trend Screener Pro MT5
STE S.S.COMPANY
4.97 (36)
Trendindikator, bahnbrechende, einzigartige Lösung für Trendhandel und -filterung mit allen wichtigen Trendfunktionen in einem Tool! Es handelt sich um einen 100 % nicht neu zu malenden Multi-Timeframe- und Multi-Währungs-Indikator, der für alle Symbole/Instrumente verwendet werden kann: Forex, Rohstoffe, Kryptowährungen, Indizes und Aktien. Trend Screener ist ein effizienter Trendfolgeindikator, der Pfeiltrendsignale mit Punkten im Diagramm liefert. Die Funktionen, die im Trendanalysator-Indika
50 USD
Trend Screener
STE S.S.COMPANY
4.75 (57)
Trendindikator, bahnbrechende, einzigartige Lösung für Trendhandel und -filterung mit allen wichtigen Trendfunktionen in einem Tool! Es handelt sich um einen 100 % nicht neu zu malenden Multi-Timeframe- und Multi-Währungs-Indikator, der für alle Symbole/Instrumente verwendet werden kann: Forex, Rohstoffe, Kryptowährungen, Indizes und Aktien. Trend Screener ist ein effizienter Trendfolgeindikator, der Pfeiltrendsignale mit Punkten im Diagramm liefert. Die Funktionen, die im Trendanalysator-Indika
50 USD
Unsere Unterstützungs- oder Widerstandsniveaus werden gebildet, wenn sich die Preisbewegung eines Marktes umkehrt und die Richtung ändert und einen Höchst- oder Tiefpunkt (Swing Point) im Markt hinterlässt. Unterstützungs- und Widerstandsniveaus können Handelsspannen ausmachen. Der Indikator identifiziert das Swing High und Swing Low basierend auf der Anzahl von X Balken (Periode), die im Indikatorsatz definiert sind. Hinweis: Wenn Ihnen unser Preisaktionsindikator gefällt, probieren Sie unse
FREE
Trend Monitor for MT4
STE S.S.COMPANY
4.44 (54)
Ein benutzerdefinierter MT5-Indikator (Metatrader 5), der den Trend- und Volatilitätsanalysator-Indikator analysiert. Darüber hinaus identifiziert es den Anfang und das Ende des Trends, der für die meisten Währungspaare und Zeitrahmen funktioniert. Zusammenfassend haben wir es basierend auf der Super Trend Formula codiert, um durch Hinzufügen eines Volatilitätsanalysators genauer zu sein. Suchen Sie nach einem guten und zuverlässigen Unterstützungs- und Widerstandsindikator, probieren Sie u
FREE
Support And Resistance Screener ist ein Level-Indikator für MetaTrader, der mehrere Tools innerhalb eines Indikators bietet. Die verfügbaren Werkzeuge sind: 1. Marktstruktur-Screener. 2. Bullische Pullback-Zone. 3. Bärische Pullback-Zone. 4. Tägliche Pivot-Punkte 5. wöchentliche Pivots-Punkte 6. monatliche Pivots-Punkte 7. Starke Unterstützung und Widerstand basierend auf harmonischem Muster und Volumen. 8. Zonen auf Bankebene. ZEITLICH BEGRENZTES ANGEBOT: HV Support and Resistance Indicator ist
50 USD
Support Resistance screnner
STE S.S.COMPANY
4.82 (28)
Support And Resistance Screener ist ein Level-Indikator für MetaTrader, der mehrere Tools innerhalb eines Indikators bietet. Die verfügbaren Werkzeuge sind: 1. Marktstruktur-Screener. 2. Bullische Pullback-Zone. 3. Bärische Pullback-Zone. 4. Tägliche Pivot-Punkte 5. wöchentliche Pivots-Punkte 6. monatliche Pivots-Punkte 7. Starke Unterstützung und Widerstand basierend auf harmonischem Muster und Volumen. 8. Zonen auf Bankebene. ZEITLICH BEGRENZTES ANGEBOT: HV Support and Resistance Indicator ist
50 USD
Trend Line Map Pro
STE S.S.COMPANY
4.69 (13)
Trend Line Map Indicator ist ein Add-On für Trend Screener Indicator . Es arbeitet als Scanner für alle Signale, die vom Trendscreener (Trendliniensignale) erzeugt werden. Es ist ein Trend Line Scanner basierend auf dem Trend Screener Indicator. Wenn Sie keinen Trend Screener Pro Indicator haben, funktioniert die Trend Line Map Pro nicht. Wenn Sie auf unseren MQL5-Blog zugreifen, können Sie die kostenlose Version des Trend Line Map-Indikators herunterladen. Probieren Sie es aus, bevor S
50 USD
Xmaster Formula for MT5
STE S.S.COMPANY
4.25 (8)
Der Xmaster-Formelindikator analysiert den Trend. Darüber hinaus generiert es Kauf- und Verkaufssignale, die für die meisten Währungspaare und Zeitrahmen funktionieren. Zusammenfassend haben wir die Formel von Xmaster optimiert, um genauer zu sein, indem wir einen Volatilitätsanalysator und eine Multi-Timeframe-Analyse hinzugefügt haben. ZEITLICH BEGRENZTES ANGEBOT: Alle unsere Premium-Indikatoren sind für nur 50 $ erhältlich. Wenn Sie auf unseren MQL5-Blog zugreifen, finden Sie alle Detail
FREE
Unser Indikator bietet einen Spread-Screener, um den Spread mehrerer Paare gleichzeitig zu überwachen, und auch ein Candle-Timer-Countdown zeigt die verbleibende Zeit an, bevor der aktuelle Balken schließt und sich ein neuer Balken bildet. ZEITLICH BEGRENZTES ANGEBOT: Alle unsere Premium-Indikatoren sind für nur 50 $ erhältlich. Wenn Sie auf unseren MQL5-Blog zugreifen, finden Sie alle Details unserer Premium-Indikatoren.   Klick hier. Hauptmerkmale Überwachen Sie die Ausbreitung mehrerer
FREE
Trend Monitor for MT5
STE S.S.COMPANY
4.44 (18)
Ein benutzerdefinierter MT5-Indikator (Metatrader 5), der den Trend- und Volatilitätsanalysator-Indikator analysiert. Darüber hinaus identifiziert es den Anfang und das Ende des Trends, der für die meisten Währungspaare und Zeitrahmen funktioniert. Zusammenfassend haben wir es basierend auf der Super Trend Formula codiert, um durch Hinzufügen eines Volatilitätsanalysators genauer zu sein. Suchen Sie nach einem guten und zuverlässigen Unterstützungs- und Widerstandsindikator, probieren Sie u
FREE
Der Boom and Crash Spike Detector Indikator ist basierend auf einer fortschrittlichen Strategie kodiert, hauptsächlich um den Boom und Crash in den Preisen zu erkennen. Komplexe Algorithmen wurden implantiert, um Booms und Crashs mit hoher Wahrscheinlichkeit in den Preisen zu erkennen. Es warnt vor möglichen Boom- oder Crash-Phasen: Boom-Phase: Wenn der Preis zu schnell steigt. Crash-Phase: Wenn der Preis zu schnell sinkt. ZEITLICH BEGRENZTES ANGEBOT: Der Indikator ist für nur 50 $ und leben
50 USD
Unser Indikator bietet einen Spread-Screener, um den Spread mehrerer Paare gleichzeitig zu überwachen, und auch ein Candle-Timer-Countdown zeigt die verbleibende Zeit an, bevor der aktuelle Balken schließt und sich ein neuer Balken bildet. ZEITLICH BEGRENZTES ANGEBOT: Alle unsere Premium-Indikatoren sind für nur 50 $ erhältlich. Wenn Sie auf unseren MQL5-Blog zugreifen, finden Sie alle Details unserer Premium-Indikatoren. Klick hier. Hauptmerkmale Überwachen Sie die Ausbreitung mehrerer P
FREE
Die Average Daily Range zeigt die durchschnittliche Pip-Range eines Forex-Paares, gemessen über eine bestimmte Anzahl von Perioden. Händler können die ADR verwenden, um potenzielle Kursbewegungen außerhalb der durchschnittlichen täglichen Bewegung zu visualisieren. Wenn die ADR über dem Durchschnitt liegt, bedeutet dies, dass die tägliche Volatilität höher als üblich ist, was bedeutet, dass das Währungspaar möglicherweise über seine Norm hinausgeht. Unser ADR-Analysator besteht aus 5 Hauptfun
50 USD
Der Xmaster-Formelindikator analysiert den Trend. Darüber hinaus generiert es Kauf- und Verkaufssignale, die für die meisten Währungspaare und Zeitrahmen funktionieren. Zusammenfassend haben wir die Formel von Xmaster optimiert, um genauer zu sein, indem wir einen Volatilitätsanalysator und eine Multi-Timeframe-Analyse hinzugefügt haben. ZEITLICH BEGRENZTES ANGEBOT: Alle unsere Premium-Indikatoren sind für nur 50 $ erhältlich. Wenn Sie auf unseren MQL5-Blog zugreifen, finden Sie alle Detail
FREE
Eine persönliche Implementierung des Higher High- und Lower Low-Musters. Der Händler sollte in den Markt einsteigen oder nach Trades in der Richtung des Marktes suchen, die wir erstellt und optimiert haben, um dieses Höher-Hoch- und Niedriger-Tief-Muster genauer zu machen. Die Marktstruktur besteht hauptsächlich aus 2 wichtigen Mustern: Höheres Hoch: Wenn der Preis ein höheres Hoch erreicht und der Preis basierend auf diesem Muster weiter steigt. Niedrigeres Tief: Wenn der Preis ein niedrig
50 USD
A tool that analyzes the trades performance and gives all necessary ratios to analyze accounts history. Trade Analyzer for MT4 has 2 main features :  Display Account Analysis in the main chart with a screener. Generate CSV document with all closed trades performance.  LIMITED TIME OFFER : Trades Analyzer is available for only 50 $ and lifetime. ( Original price 125$ ) Key features Screener to Display Trades Performance. Analyze Trades Per Magic Number, Per Symbol or Per Comments. Export t
50 USD
This indicator is intended to assist in the backtesting process. It can be used to highlight time zone session   based on your time setting   in which you are either asleep or away from your charts, or intraday trading sessions that you want to trade. It will help you to monitor the market move during a period of time. Key features Selecting trading zone time ( Beginning and ending time ) Highlight the trading zone ( Highest High and Lowest low of that specified session ) 100% free indicator
FREE
Der Boom and Crash Spike Detector Indikator ist basierend auf einer fortschrittlichen Strategie kodiert, hauptsächlich um den Boom und Crash in den Preisen zu erkennen. Komplexe Algorithmen wurden implantiert, um Booms und Crashs mit hoher Wahrscheinlichkeit in den Preisen zu erkennen. Es warnt vor möglichen Boom- oder Crash-Phasen: Boom-Phase: Wenn der Preis zu schnell steigt. Crash-Phase: Wenn der Preis zu schnell sinkt. ZEITLICH BEGRENZTES ANGEBOT: Der Indikator ist für nur 50 $ und leben
50 USD
This indicator is intended to assist in the backtesting process. It can be used to highlight time zone session based on your time setting in which you are either asleep or away from your charts, or intraday trading sessions that you want to trade. It will help you to monitor the market move during a period of time. Key features Selecting trading zone time ( Beginning and ending time ) Highlight the trading zone ( Highest High and Lowest low of that specified session ) 100% free indicator. Wor
FREE
Jeder Trader weiß, dass er oder sie nie mehr als 5 % (oder 7 %) pro Trade riskieren sollte. Dies ist ein Money-Management-Gesetz und es sollte jedes Mal eine brauchbare LotSize berechnet werden, da ein Trader für verschiedene Trading-Levels einen anderen StopLoss-Wert verwenden muss. Dieser Indikator berechnet eine angemessene LotSize für den Moment, in dem Sie ihn auf das Diagramm setzen und jedes Mal, wenn Sie die „Stop-Loss-Linie“ in eine beliebige Richtung ziehen. ZEITLICH BEGRENZTES AN
50 USD
Die Average Daily Range zeigt die durchschnittliche Pip-Range eines Forex-Paares, gemessen über eine bestimmte Anzahl von Perioden. Händler können die ADR verwenden, um potenzielle Kursbewegungen außerhalb der durchschnittlichen täglichen Bewegung zu visualisieren. Wenn die ADR über dem Durchschnitt liegt, bedeutet dies, dass die tägliche Volatilität höher als üblich ist, was bedeutet, dass das Währungspaar möglicherweise über seine Norm hinausgeht. Unser ADR-Analysator besteht aus 5 Hauptfun
50 USD
Currency Strength Meter, gibt Ihnen einen schnellen visuellen Überblick darüber, welche Währungen derzeit stark und welche schwach sind. Das Messgerät misst die Stärke aller Forex-Kreuzpaare und wendet Berechnungen an, um die Gesamtstärke für jede einzelne Währung zu bestimmen. Wir berechnen die Stärke der Währung basierend auf dem Trend von 28 Paaren. Wenn Sie auf unseren MQL5-Blog zugreifen, können Sie die kostenlose Version des Indikators herunterladen. Probieren Sie es aus, bevor Sie
50 USD
Der Volatilitätsanalysator ist ein Momentum-Indikator, der von der Tendenz profitiert, dass der Preis nach der Konsolidierung in einer engen Handelsspanne stark ausbricht. Der Indikator verwendet auch einen Momentum-Oszillator, um die erwartete Richtung der Bewegung anzuzeigen, wenn der Squeeze ausgelöst wird. Dieses Histogramm oszilliert um die Nulllinie, ein steigendes Momentum über der Nulllinie zeigt eine Gelegenheit zum Long-Kauf an, während ein Momentum, das unter die Nulllinie fällt, ein
50 USD
Jeder Trader weiß, dass er oder sie nie mehr als 5 % (oder 7 %) pro Trade riskieren sollte. Dies ist ein Money-Management-Gesetz und es sollte jedes Mal eine brauchbare LotSize berechnet werden, da ein Trader für verschiedene Trading-Levels einen anderen StopLoss-Wert verwenden muss. Dieser Indikator berechnet eine angemessene LotSize für den Moment, in dem Sie ihn auf das Diagramm setzen und jedes Mal, wenn Sie die „Stop-Loss-Linie“ in eine beliebige Richtung ziehen. ZEITLICH BEGRENZTES AN
50 USD
Pin Bar Detector ist ein Indikator, der das Preisaktionsmuster von Pin Bars auf dem Chart findet. Pin Bars ist eine Abkürzung für „Pinocchio Bars“, eine klassische Balkenmuster-Alternative zu japanischen Candlesticks mit hohen oberen oder unteren Schatten und sehr kleinen Körpern wie Dragon Fly Doji, Grave Stone Doji, Hammer, Inverted-Hammer, Hanging Man und Shooting Star . ZEITLICH BEGRENZTES ANGEBOT: Der Indikator ist für nur 50 $ und lebenslang erhältlich. (Originalpreis 125 $) Hauptmerk
50 USD
Der Volatilitätsanalysator ist ein Momentum-Indikator, der von der Tendenz profitiert, dass der Preis nach der Konsolidierung in einer engen Handelsspanne stark ausbricht. Der Indikator verwendet auch einen Momentum-Oszillator, um die erwartete Richtung der Bewegung anzuzeigen, wenn der Squeeze ausgelöst wird. Dieses Histogramm oszilliert um die Nulllinie, ein steigendes Momentum über der Nulllinie zeigt eine Gelegenheit zum Long-Kauf an, während ein Momentum, das unter die Nulllinie fällt, ein
50 USD
Currency Strength Meter, gibt Ihnen einen schnellen visuellen Überblick darüber, welche Währungen derzeit stark und welche schwach sind. Das Messgerät misst die Stärke aller Forex-Kreuzpaare und wendet Berechnungen an, um die Gesamtstärke für jede einzelne Währung zu bestimmen. Wir berechnen die Stärke der Währung basierend auf dem Trend von 28 Paaren. Wenn Sie auf unseren MQL5-Blog zugreifen, können Sie die kostenlose Version des Indikators herunterladen. Probieren Sie es aus, bevor Sie
50 USD
Pin Bar Detector ist ein Indikator, der das Preisaktionsmuster von Pin Bars auf dem Chart findet. Pin Bars ist eine Abkürzung für „Pinocchio Bars“, eine klassische Balkenmuster-Alternative zu japanischen Candlesticks mit hohen oberen oder unteren Schatten und sehr kleinen Körpern wie Dragon Fly Doji, Grave Stone Doji, Hammer, Inverted-Hammer, Hanging Man und Shooting Star . ZEITLICH BEGRENZTES ANGEBOT: Der Indikator ist für nur 50 $ und lebenslang erhältlich. (Originalpreis 125 $) Hauptmerk
50 USD
Auswahl:
T.J.Sch_318798
151
T.J.Sch_318798 2023.03.02 18:33 
 

This indicator is excellent. It greatly helps you to identify great teading oportunities & trend predictor helps correctly predict the trend and avoid traps. The service provided by Sayadi is amazing. This & trend predictor are excellent choice for having great - safe trading.

pdev
549
pdev 2023.02.06 08:35 
 

Great indicator and an indispensable add-on for trend screener indicator. Very helpful and responsive seller

Johan Ferdianto
135
Johan Ferdianto 2022.03.05 18:35 
 

I already have version for MT4, I complete for MT5 too. Great job, good Indicator

Maungfortrading
229
Maungfortrading 2022.02.08 14:15 
 

Best Indicator !!

caichenyi
106
caichenyi 2021.09.06 14:51 
 

I try to run `Trend Screener Pro` and `Trend Line Map` in MT5 at the same time. It can only run for a short time about 15 mins, then the 2 Indicators wouldn't update and the Chart will freeze.

If I close `Trend Line Map`, it works normally.

please help to check this issue. this issue block uses these indicators.

Besides, It's only V5.10, the version is so low than MT4(Trend Line Map).

STE S.S.COMPANY
421711
Antwort vom Entwickler Sayadi Achraf 2021.09.09 18:26
Hi sir. Thank you for your review. You can't attach 2 screeners in the same chart, you need to have one screener per chart sir. Example :
1. Chart 1 => Trend Screener Pro
2. Chart 2 => Trend Line Map Pro. In this way, you can run both 2 indicators sir to analyze the trend, sir. Please if you have any questions, feel free to contact me, sir. Imporant Note :
- MT4 version is faster because MT4 is much faster in managing multi-currencies data than MT5 sir. - Please make sure that you have historical data available to make the indicator much faster in loading signals. It's a signal calculator and not a simple indicator sir. Best regards.
SAYADI Ashref.
Crypto King
177
Crypto King 2021.01.17 09:08 
 

Another Great product from Mr. Sayadi ! Thank you.

STE S.S.COMPANY
421711
Antwort vom Entwickler Sayadi Achraf 2021.01.17 09:30
Thx u sir.
Antwort auf eine Rezension
Version 6.20 2023.01.13
1. Improve indicator performance and calculation speed.
2. Add the Update Frequency parameter in seconds.
Version 6.11 2022.04.27
1. Optimizing indicator speed for low computer CPU.
Version 6.0 2021.09.22
1. Fixing issue of wrong signals based Trend Screener Pro Indicator.
2. Optimizing the indicator to the last MT5 versions to make more faster.
------------------

Highly recommended to upgrade to the last version of the Trend Line Map indicator.