• Aperçu
  • Avis (7)
  • Commentaires (3)
  • Nouveautés

Trend Line Map Pro MT5

4.8

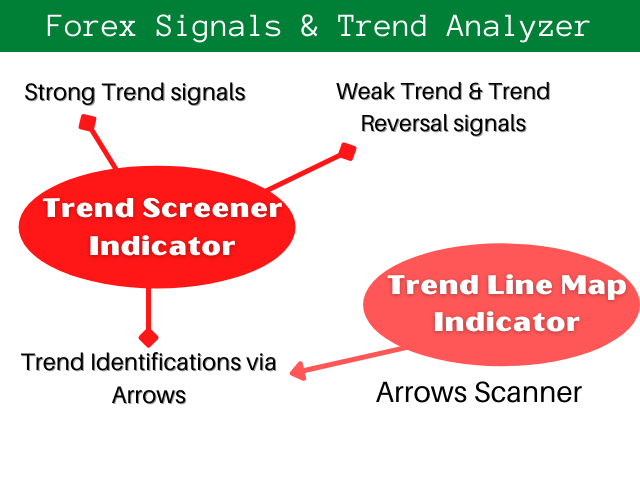
Trend Line Map indicator is an addons for Trend Screener Indicator. It's working as a scanner for all signals generated by Trend screener ( Trend Line Signals ) .

It's a Trend Line Scanner based on Trend Screener Indicator.  If you don't have Trend Screener Pro Indicator,  the Trend Line Map Pro will not work. 


LIMITED TIME OFFER : Trend Line Map Indicator is available for only 50 $ and lifetime. ( Original price 125$ )

By accessing to our MQL5 Blog,  you can find all our premium indicators with analysis examples : Click Here


1. Advantages You Get Easy

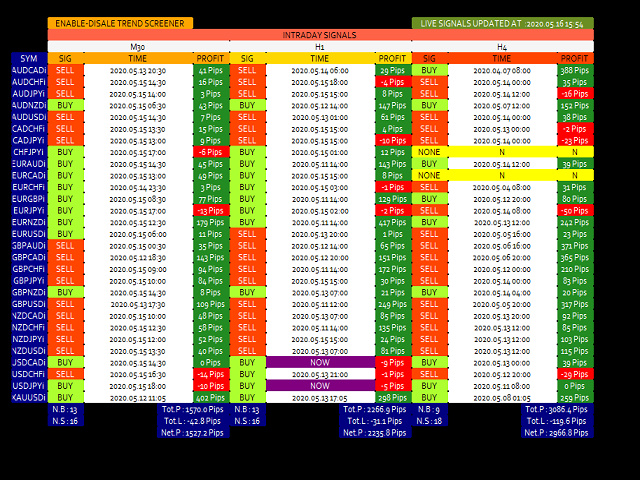
  • Display Buy and Sell signals based on Currencies and Time Frames.
  • Evaluate how many pips the price increased or decreased since the arrows appeared in the chart. ( Trend Screener Indicators Arrows )
  • Display the timing of signals.
  • Getting a multi-timeframe and multi-currencies  Alerts to buy and sell alerts.

2. How to use Trend Line Map

All Trend Line Map documentations ( Instructions ) and strategy details are available in this post in our MQL5 Blog : Click Here.


3. Tips to improve indicator calculation performance

1. Ensure that you download the data of the pairs that you will analyze.
2. Set the Update Frequency to 60 seconds. ( Default 20 seconds )
3. The maximum number of pairs to monitor should be more than 12 pairs to have a maximum performance of the trend performance calculation.
4. Attach indicator to H1 timeframe.


4. Contact

If you have some questions or if you need help, Contact me via Private Message.


Author

SAYADI ACHREF , fintech software engineer and founder of Finansya.

Avis 7
T.J.Sch_318798
216
T.J.Sch_318798 2023.03.02 18:33 
 

This indicator is excellent. It greatly helps you to identify great teading oportunities & trend predictor helps correctly predict the trend and avoid traps. The service provided by Sayadi is amazing. This & trend predictor are excellent choice for having great - safe trading.

pdev
556
pdev 2023.02.06 08:35 
 

Great indicator and an indispensable add-on for trend screener indicator. Very helpful and responsive seller

Maungfortrading
249
Maungfortrading 2022.02.08 14:15 
 

Best Indicator !!

Produits recommandés
Noize Absorption Index - is the manual trading system that measures the difference of pressure between bears forces and bulls forces. Green line - is a noize free index that showing curent situation. Zero value of index shows totally choppy/flat market.Values above zero level shows how powerfull bullish wave is and values below zero measures bearish forces.Up arrow appears on bearish market when it's ready to reverse, dn arrow appears on weak bullish market, as a result of reverse expectation.
199 USD
Laguerre SuperTrend Clouds   adds an Adaptive Laguerre averaging algorithm and alerts to the widely popular SuperTrend indicator. As the name suggests,   Laguerre SuperTrend Clouds (LSC)   is a trending indicator which works best in trendy (not choppy) markets. The SuperTrend is an extremely popular indicator for intraday and daily trading, and can be used on any timeframe. Incorporating Laguerre's equation to this can facilitate more robust trend detection and smoother filters. The LSC uses the
30 USD
Le niveau Premium est un indicateur unique avec une précision de plus de 80 % des prédictions correctes ! Cet indicateur a été testé par les meilleurs Trading Specialists depuis plus de deux mois ! L'indicateur de l'auteur que vous ne trouverez nulle part ailleurs ! À partir des captures d'écran, vous pouvez constater par vous-même la précision de cet outil ! 1 est idéal pour le trading d'options binaires avec un délai d'expiration de 1 bougie. 2 fonctionne sur toutes les paires de de
1 100 USD
Alpha Binary Pro
Rafael Alejandro Rey Alves
1 (1)
The Alpha Binary Pro indicator is intended to work in different scenarios. This indicator uses a combination of technical indicators to detect buy or sell opportunities. The indicator works with any currency pair, stocks, cryptocurrencies and synthetic indices. The indicated can be used for both traditional trading and binary options. The indicator works with any time frame, from M1 to MN. When the blue arrow is pointing upwards this indicates that the signal is to buy. When the red
30 USD
The Gann Box (or Gann Square) is a market analysis method based on the "Mathematical formula for market predictions" article by W.D. Gann. This indicator can plot three models of Squares: 90, 52(104), 144. There are six variants of grids and two variants of arcs. You can plot multiple squares on one chart simultaneously. Parameters Square — selection of a square model: 90 — square of 90 (or square of nine); 52 (104) — square of 52 (or 104); 144 — universal square of 144; 144 (full) — "full"
52 USD
Blahtech VWAP - Volume Weighted Average Price (VWAP) is the ratio of price to total volume. It provides an average price over a specified time interval.  Links [  Install  |  Update  |  Documentation   ] Feature Highlights Configurable VWAP Line Sessions, intervals, anchored or continuous Previous day settlement line Standard Deviation bands Alerts at bar close or real time Automatic Broker or Tick volumes Significantly reduced CPU usage Input Parameters Max Bars   - Restrict the number of
49 USD
Perfect Sniper
Ignacio Agustin Mene Franco
Perfect Sniper! is a triple indicator with support resistance detection, downtrend channel, uptrend channel Bands included! where he hunts the rebounds in the red lines for sale, in the green lines mark purchase, in the lower bands that are the breaks gives another second entry either buy or sell, perfect to take advantage of the double entrance, It is used in any temporality, It is used to scalp and long on h1 or h4 to D1. It works for Forex markets, All pairs. It is used for the synthetic inde
100 USD
Trend Fibonacci is a unique indicator that combines a power of Fibonacci sequences and ranges. How to read: - There are three zones --> red, gold and green - Red candlestick = downtrend - Green candlestick = uptrend   - Gold candlestick = no established trend Inputs: Per = number of bars used for calculations FirstRatio = first Fibonacci ratio (Or use any ratio you want) SecondRatio = second Fibonacci ratio (Or use any ratio you want) !! IF YOU PURCHASE THE INDICATOR, CONTACT ME FOR
47 USD
An indicator of pattern #31 ("Long Island") from Encyclopedia of Chart Patterns by Thomas N. Bulkowski. The second gap is in the opposite direction. Parameters: Alerts - show alert when an arrow appears   Push - send a push notification when an arrow appears (requires configuration in the terminal) GapSize - minimum gap size in points ArrowType - a symbol from 1 to 17 ArrowVShift - vertical shift of arrows in points   ShowLevels - show levels ColUp - color of an upward line ColDn - color of a
30 USD
Tunafish EA
Ismaele Daniele Lodetti
Tunafish EA is the most efficient EA on my profile. I spent a lot of time and effort to make this software sophisticated with possibilities of high potential returns while keeping the drawdown below 25%. The algorithms of the robot provide investors of any level of training with an investment opportunity that is both safe and aggressive. Tunafish EA imitating the work of the brain, capable of learning and adapting to changing conditions and predicting situations. When applied to trading in fina
69 USD
Cet indicateur vous montrera les valeurs TP et SL (dans cette devise) que vous avez déjà définies pour chaque commande sur les graphiques (fermées à la ligne de transaction/commande) qui vous aideront beaucoup à estimer vos profits et pertes pour chaque commande. Et il vous montre également les valeurs PIP. le format affiché est "Valeurs monétaires de nos valeurs de profit ou de perte / PIPs". La valeur TP sera affichée en couleur verte et la valeur SL sera affichée en couleur rouge. Pour tou
99 USD
This Indicator comes handy for everyone who uses Support and Resistance zones when trading. It will not only show you all major Supp/Res zones on the chart, but it will also notify you in a case of possible entry signal. Thanks to its customization possibilities, it will be the only indicator you will need when it comes down to trading Supp and Resistance zones.  !! If you decide to purchase the product, please contact me for further support and useful tips !! 
57 USD
SBA scalping v75
Umri Azkia Zulkarnaen
ini adalah indikator khusus digunakan untuk trading di binary.com dengan pair volatility 75. indikator ini sangat simpel dan mudah digunakan baik untuk yang sudah profesional atau pun yang baru dalam dunia trading terutama yang baru di market volatility 75.indikator ini lebih bertujuan untuk scalping trader dan menggunakan timeframe M1 sebagai acuan untuk entry. adapun jika ingin mempelajari lebih lanjut bisa menghubungi di telegram  https://t.me/shadowbreakerfx . untuk SOP lengkap silahkan klik
110 USD
Modified Rainbow
Rafael Alejandro Rey Alves
Modified Rainbow   The Modified Rainbow indicator is intended to work in different scenarios. The indicator uses a combination of technical indicators to detect buy or sell opportunities (different Moving Averages and other technical indicators). The indicator works with any currency pair, stocks, cryptocurrencies and synthetic indices. The indicator can be used for both traditional trading and binary options. The indicator works with any time frame, from M1 to MN. When the blue arrow
30 USD
To get access to MT4 version please click here . - This is the exact conversion from TradingView: "Stochastic Momentum Index" By "UCSgears". - This is a popular version of stochastic oscillator on tradingview. - This is a light-load processing and non-repaint indicator. - Buffers are available for the lines on chart. - You can message in private chat for further changes you need. Thanks for downloading
40 USD
This MT5 indicator has been designed to be used on any currency pair and any time frame . It has the scalper and swing trader in mind.  The indicator looks for short-term high-probability reversals in price and will indicate to you to go long (buy) or short (sell) if you see a green or red arrow next to the current candlestick respectively. The indicator provides the best trading opportunities to you during the active trading hours of London and New York, but it will continue to give signals al
199 USD
Volality Index scalper indicator  Meant for Volality pairs such as Volality 10, 25, 50, 75 and 100 The indicator works on all timeframes from the 1 minute to the monthly timeframe the indicator is non repaint the indicator has 3 entry settings 1 color change on zero cross 2 color change on slope change 3 color change on signal line cross Orange line is your sell signal Blue line is your buy signal.
35 USD
L'une des séquences de numéros s'appelle « Séquence des incendies de forêt ». Il a été reconnu comme l'une des plus belles nouvelles séquences. Sa principale caractéristique est que cette séquence évite les tendances linéaires, même les plus courtes. C'est cette propriété qui a constitué la base de cet indicateur. Lors de l'analyse d'une série chronologique financière, cet indicateur essaie de rejeter toutes les options de tendance possibles. Et seulement s'il échoue, il reconnaît alors la prés
30 USD
Rainbow EA MT5
Jamal El Alama
Description : Rainbow EA MT5 is a simple Expert advisor based on   Rainbow MT5 indicator witch is based on Moving average with period 34. The indicator is incorporated in the EA, therefore, it is not required for the EA to operate, but if you wish, you can download it from   my product page . The Expert Advisor settings are as follows : Suitable for Timeframes up to H1 The parameters below can be set according to your trading rules. StopLoss ( Stop Loss in pips) TakeProfit ( Take Profit in pi
59 USD
Candlestick Pattern Scanner is a multi-timeframe and multi-symbol dashboard and alert system that checks all timeframes and currency pairs for different candlestick patterns that are formed in them. Scanner is integrated   with support and resistance zones so you can check the candlestick patterns in most important areas of the chart to find breakout and reversal patterns in the price chart. Download demo version   (works on M4,M5,M6,M12,H3,H8 timeframes) Read the full description of scanner par
60 USD
The best time to trade Using this Indicator is when the time reach exactly hour,half,45 minutes,15 minutes and sometimes 5 minutes.. This indicators is helpful to those who trade boom and crash indecies.How to read this indicator first you'll see Blue allow and Red allow all these allows used to indicate or to detect the spike which will happen so the allow happens soon before the spike happen.This indicator works properly only in boom and crash trading thing which you have to consider when
30 USD
Your Trend Friend
Luigi Nunes Labigalini
The trend is your friend! Look at the color of the indicator and trade on that direction. It does not  repaint. After each candle is closed, that's the color of the trend. You can focus on shorter faster trends or major trends, just test what's most suitable for the symbol and timeframe you trade. Simply change the "Length" parameter and the indicator will automatically adapt. You can also change the color, thickness and style of the lines. Download and give it a try! There are big movements
99 USD
Renko Gold
Ignacio Agustin Mene Franco
Renko Gold! clearly indicates the floors and ceilings where it goes from 4 lines, the line below that marks the floor in green confirming with the thinnest line clarifies the purchase entry, the same is for sale, the top line marks the ceiling and the thinnest red line marks the sale, This indicator works for all temporalities! For Forex and Synthetic Indices markets! It also works for crypto markets! Good profit! World Investor.
40 USD
Trend Side - un indicateur technique pour déterminer la tendance. Il s'agit d'un ensemble de plusieurs stratégies de trading à part entière. L'indicateur utilise un système de filtrage de tendance avancé, dispose d'un panneau statistique, calcule les niveaux d'entrée et de sortie et calcule le niveau dynamique du Trailing Stop. Convient à tout type de symboles, ne redessine jamais ses signaux et résultats. Un outil complet pour le trading de tendances professionnel. L'ensemble de l'indicateur
50 USD
Revenge Trading Protector is a simple but effective tool for traders who can fall victim to revenge trading. Being a day-trader myself, I understand the psychological aspect of revenge trading and the desire to cover the losses. So, I developed this tool (that I use myself too) to be 100% sure I’m able to remain patient after a loss and not make irrational trading decisions. When you take a loss, the Revenge Trading Protector EA prevents you from opening another order   (either limit order, s
45 USD
Pipfinite creates unique, high quality and affordable trading tools. Our tools may or may not work for you, so we strongly suggest to try the Demo Version for MT4 first. Please test the indicator prior to purchasing to determine if it works for you. We want your good reviews, so hurry up and test it for free...we hope you will find it useful. Combo Energy Beam with Swing Control Strategy: Confirm swing pullback signals Watch Video: (Click Here) Energy Beam with Trend Laser Strategy: Confirm Tr
88 USD
Automatic fibonacci with alerts is an indicator that automatically plots a fibonacci retracement based on the number of bars you select on the BarsToScan setting in the indicator. The fibonacci is automatically updated in real time as new highest and lowest values appear amongst the selected bars. You can select which level values to be displayed in the indicator settings. You can also select the color of the levels thus enabling the trader to be able to attach the indicator several times with d
30 USD
Il s'agit d'un indicateur MTF des niveaux de support et de résistance basé sur les   extremums de l'indicateur Advanced ZigZag Dynamic   et/ou   Extended Fractals   avec des étiquettes de prix (peut être désactivé). Des TF plus élevés peuvent être sélectionnés pour le mode MTF. Par défaut, les niveaux sont générés en fonction des points indicateurs ZigZag. Les points indicateurs de fractales peuvent également être utilisés avec ZigZag ou à sa place. Afin de simplifier l'utilisation et d'économis
30 USD
Magic Finger can help you identify trends and trading opportunities clearly. The finger points to the open position signal, and the discoloration line is confirmed by the trend. If you are a day trader, you can choose to trade during a period of active trading, referring to the discoloration line as the basis for the next order, finger signal as a filter. If you are a trend trader, you can choose a period above H1, wait for the appearance of the finger signal in the key price area, and enter
188 USD
No Demand No Supply MT5
Trade The Volume Waves Single Member P.C.
No Demand No Supply   This indicator identifies   No Demand –No Supply candles  to your chart and plots volume bars colored according to the signal. It can be applied to all timeframes or to a specific one only. It can also be used as regular volume indicator  with exceptional future of WEIGHTED VOLUME. Furthermore is has an alert notification, sound and email when a signals occurs. The indicator does not repaint but the alert will come on two candles back due to the definition of No Demand No S
80 USD
Les acheteurs de ce produit ont également acheté
ICT, SMC, SMART MONEY CONCEPTS, SMART MONEY, Smart Money Concept, Support and Resistance, Trend Analysis, Price Action, Market Structure, Order Blocks, BOS/CHoCH,   Breaker Blocks ,  Momentum Shift,   Supply&Demand Zone/Order Blocks , Strong Imbalance,   HH/LL/HL/LH,    Fair Value Gap, FVG,  Premium  &   Discount   Zones, Fibonacci Retracement, OTE, Buy Side Liquidity, Sell Side Liquidity, BSL/SSL Taken, Equal Highs & Lows, MTF Dashboard, Multiple Time Frame, BigBar, HTF OB, HTF Market Structur
65 USD
Top indicator for MT5   providing accurate signals to enter a trade without repainting! It can be applied to any financial assets: forex, cryptocurrencies, metals, stocks, indices .  MT4 version is here It will provide pretty accurate trading signals and tell you when it's best to open a trade and close it. Watch  the video  (6:22) with an example of processing only one signal that paid off the indicator! Most traders improve their trading results during the first trading week with the help of
125 USD
AW Trend Predictor MT5
Alexander Nechaev
5 (34)
La combinaison des niveaux de tendance et de panne dans un seul système. Un algorithme d'indicateur avancé filtre le bruit du marché, détermine la tendance, les points d'entrée, ainsi que les niveaux de sortie possibles. Les signaux indicateurs sont enregistrés dans un module statistique, qui vous permet de sélectionner les outils les plus appropriés, montrant l'efficacité de l'historique des signaux. L'indicateur calcule les marques Take Profit et Stop Loss. Manuel et instruction ->   ICI   / v
55 USD
Advanced Supply Demand MT5
Bernhard Schweigert
4.42 (12)
La meilleure solution pour tout commerçant débutant ou expert ! Cet indicateur est un outil de trading unique, de haute qualité et abordable car nous avons intégré un certain nombre de fonctionnalités propriétaires et une nouvelle formule. Avec cette mise à jour, vous pourrez afficher des zones à double horaire. Vous pourrez non seulement afficher un TF plus élevé, mais afficher les deux, le graphique TF, PLUS le TF supérieur : AFFICHAGE DES ZONES NICHÉES. Tous les traders Supply Demand vont ado
199 USD
Matrix Arrow Indicator MT5
Juvenille Emperor Limited
5 (11)
Matrix Arrow Indicator MT5   est une tendance unique 10 en 1 suivant un indicateur multi-période   100% non repeint   qui peut être utilisé sur tous les symboles/instruments:   forex ,   matières premières ,   crypto-monnaies ,   indices ,  actions .  Matrix Arrow Indicator MT5  déterminera la tendance actuelle à ses débuts, en rassemblant des informations et des données à partir d'un maximum de 10 indicateurs standard, qui sont: Indice de mouvement directionnel moyen (ADX) Indice de canal de m
75 USD
Blahtech Supply Demand MT5
Blahtech Limited
4.45 (11)
Supply Demand uses previous price action to identify potential imbalances between buyers and sellers. The key is to identify the better odds zones, not just the untouched ones. Blahtech Supply Demand indicator delivers functionality previously unavailable on any trading platform. This 4-in-1 indicator not only highlights the higher probability zones using a multi-criteria strength engine, but also combines it with multi-timeframe trend analysis, previously confirmed swings and engulfing detecto
99 USD
TPA True Price Action indicator reveals the true price action of the market makers through 100% non-repainting signals strictly at the close of a candle! TPA shows entries and re-entries, every time the bulls are definitely stronger than the bears and vice versa. Not to confuse with red/green candles. The shift of power gets confirmed at the earliest stage and is ONE exit strategy of several. There are available now two free parts of the TPA User Guide for our customers. The first "The Basics"
168 USD
Market Profile defines a number of day types that can help the trader to determine market behaviour. A key feature is the Value Area, representing the range of price action where 70% of trading took place. Understanding the Value Area can give traders valuable insight into market direction and establish the higher odds trade. It is an excellent addition to any system you may be using. Blahtech Limited presents their Market Profile indicator for the MetaTrader community. Inspired by Jim Dalton’s
99 USD
Owl Smart Levels MT5
Sergey Ermolov
5 (7)
Guide de l'indicateur   |   Stratégie Owl Smart Levels  |   Version MT4   |  Comment installer?   |   FAQ L' indicateur Owl Smart Levels est un système de trading complet au sein d'un seul indicateur qui comprend des outils d'analyse de marché populaires tels que les fractales avancées de Bill Williams , Valable ZigZag qui construit la structure d'onde correcte du marché et les niveaux de Fibonacci qui marquent les niveaux exacts d'entrée. sur le marché et les endroits où prendre des bénéfices.
97 USD
Italo Volume Indicator MT5
Italo Santana Gomes
4.69 (13)
BUY INDICATOR AND GET EA FOR FREE AS A BONUS + SOME OTHER GIFTS! ITALO VOLUME INDICATOR  is the best volume indicator ever created, and why is that? The Indicator works on all time-frames and assets, indicator built after 6 years of experience on forex and many other markets. You know many volume indicators around the internet are not complete, does not help, and it's difficult to trade, but the Italo Volume Indicator is different , the Italo Volume Indicator shows the wave volume, when market
65 USD
Auto Order Block with break of structure Detect Break of Structure , Mark Order Block and draw Entry / Stop and Risk to Reward lines when Order block is touch by price with Alert. Trend is Manually set to filter signals in a direction by a button on the chart. Entry / Stop and Risk to Reward lines can also be switch on / off by button on chart. Futures Auto Mark Break of Structure Auto Mark Order block Auto Mark higher time frame Point Of  Interest ( POI ) Popup Alert when BoS , Order block
55 USD
ACB Breakout Arrows MT5
KEENBASE SOFTWARE SOLUTIONS
5 (1)
The ACB Breakout Arrows indicator provides a crucial entry signal in the market by detecting a special breakout pattern. The indicator constantly scans the chart for a settling momentum in one direction and provide the accurate entry signal right before the major move. Get multi-symbol and multi-timeframe scanner from here - Scanner for ACB Breakout Arrows MT 5 Key features Stoploss   and Take Profit levels are provided by the indicator. Comes with a MTF Scanner dashboard which tracks the br
145 USD
Introduction to X3 Chart Pattern Scanner X3 Cherart Pattern Scanner is the non-repainting and non-lagging indicator detecting X3 chart patterns including Harmonic pattern, Elliott Wave pattern, X3 patterns, and Japanese Candlestick patterns. Historical patterns match with signal patterns. Hence, you can readily develop the solid trading strategy in your chart. More importantly, this superb pattern scanner can detect the optimal pattern of its kind. In addition, you can switch on and off individu
250 USD
Introduction to EFW Analytics EFW Analytics was designed to accomplish the statement "We trade because there are regularities in the financial market". EFW Analytics is a set of tools designed to maximize your trading performance by capturing the repeating fractal geometry, known as the fifth regularity in the financial market. The functionality of EFW Analytics consists of three parts. Firstly, Equilibrium Fractal Wave Index is an exploratory tool to support your trading logic to choose which r
200 USD
FX Power MT5
Daniel Stein
4.3 (23)
Vous voulez devenir un trader forex 5 étoiles constamment rentable ? 1.   Lisez la description de base de notre   système de   trading simple et   la mise à jour majeure de sa stratégie en 2020 . 2.   Envoyez une capture d'écran de votre achat pour recevoir votre invitation personnelle à notre chat exclusif sur le trading. FX Power   est le premier compteur de force des devises avec un historique complet sur tous les horizons temporels. Il analyse le momentum et la force de toutes les princ
66 USD
Stargogs Spike Catcher
Lorenzo Edward Beukes
5 (6)
Stargogs Spike Catcher V3.11 This Indicator is Developed To milk the BOOM and CRASH indices . Send me Message if you need any help with the indicator.  CHECK OUT THE STARGOGS SPIKE CATCHER EA/ROBOT V3: CLICK HERE ALSO CHECK OUT SECOND TO NONEFX SPIKE CATCHER:   CLICK HERE STARGOGS SPIKE CATCHER V3.11 WHATS NEW! Brand New Strategy. This is the Indicator you need for 2023. The Indicator Gives you an Entry at a time when conditions are met and you should use TP & SL. New Trendline that changes col
100 USD
XQ Indicator MT5
Marzena Maria Szmit
5 (1)
The signal conditions are a combination of three indicators, and XQ Forex Indicators only display  medium and long-term trends . The indicator's efficacy has been improved with the addition of a filter that blocks out false signals. The XQ Forex Indicator can be used on  FX pairs, CFDs, and Cryptocurrencies . There are two type of signals:  Buy or Sell and Big Long or Big Short It is possible to enable sending emails when a major trend-change signal is detected, as well as to display the alerts
179 USD
Legacy of Gann for MT5
Pavel Zamoshnikov
5 (2)
The indicator very accurately determines the levels of the possible end of the trend and profit fixing. The method of determining levels is based on the ideas of W.D.Gann, using an algorithm developed by his follower Kirill Borovsky. Extremely high reliability of reaching levels (according to K. Borovsky  - 80-90%) Indispensable for any trading strategy – every trader needs to determine the exit point from the market! Precisely determines targets on any timeframes and any instruments (forex, met
65 USD
MetaBands M5
Vahidreza Heidar Gholami
5 (2)
MetaBands uses powerful and unique algorithms to draw channels and detect trends so that it can provide traders with potential points for entering and exiting trades. It’s a channel indicator plus a powerful trend indicator. It includes different types of channels which can be merged to create new channels simply by using the input parameters. MetaBands uses all types of alerts to notify users about market events. Features Supports most of the channel algorithms Powerful trend detection algorith
129 USD
This indicator recognizes over 30 Japanese Candlestick Patterns and highlights them beautifully on the chart. It is simply one of those indicators price action traders can't live without. Boost your technical analysis overnight Detect japanese candlestick patterns easily Trade reliable and universal reversal patterns Hop onto established trends safely using continuation patterns The indicator is non-repainting and implements alerts The indicator implements a multi-timeframe dashboard It detects
99 USD
Royal Scalping Indicator M5
Vahidreza Heidar Gholami
5 (8)
Royal Scalping Indicator is an advanced price adaptive indicator designed to generate high-quality trading signals. Built-in multi-timeframe and multi-currency capabilities make it even more powerful to have configurations based on different symbols and timeframes. This indicator is perfect for scalp trades as well as swing trades. Royal Scalping is not just an indicator, but a trading strategy itself. Features Price Adaptive Trend Detector Algorithm Multi-Timeframe and Multi-Currency Trend Low
149 USD
ICT Concepts
Minh Truong Pham
The ICT Concepts indicator regroups core concepts highlighted by trader and educator "The Inner Circle Trader" (ICT) into an all-in-one toolkit. Features include Market Structure (MSS & BOS), Order Blocks, Imbalances, Buyside/Sellside Liquidity, Displacements, ICT Killzones, and New Week/Day Opening Gaps. It’s one kind of Smart money concepts. DETAILS Market Structure Market structure labels are constructed from price breaking a prior extreme point. This allows a user to determine the current ma
55 USD
Royal Wave Pro M5
Vahidreza Heidar Gholami
3.67 (3)
Royal Wave is a Trend-Power oscillator which has been programmed to locate and signal low-risk entry and exit zones. Its core algorithm statistically analyzes the market and generates trading signals for overbought, oversold and low volatile areas. By using a well-designed alerting system, this indicator makes it easier to make proper decisions regarding where to enter and where to exit trades. Features Trend-Power Algorithm Low risk Entry Zones and Exit Zones Predictions for Overbought and Over
129 USD
PZ Trend Trading MT5
PZ TRADING SLU
3.67 (3)
Trend Trading is an indicator designed to profit as much as possible from trends taking place in the market, by timing pullbacks and breakouts. It finds trading opportunities by analyzing what the price is doing during established trends. [ Installation Guide | Update Guide | Troubleshooting | FAQ | All Products ] Trade financial markets with confidence and efficiency Profit from established trends without getting whipsawed Recognize profitable pullbacks, breakouts and early reversals The ind
175 USD
PZ Swing Trading MT5
PZ TRADING SLU
5 (4)
Swing Trading is the first indicator designed to detect swings in the direction of the trend and possible reversal swings. It uses the baseline swing trading approach, widely described in trading literature. The indicator studies several price and time vectors to track the aggregate trend direction and detects situations in which the market is oversold or overbought and ready to correct. [ Installation Guide | Update Guide | Troubleshooting | FAQ | All Products ] Profit for market swings with
175 USD
Short description : TAMA is, at its core, a novel method for correcting moving averages (MAs) during trends. | This usually also results in better smoothing and a significantly lower time delay (lag) of the MAs. | The indicator can additionally be used for price forecasts and band formation, also combined. | TAMA received an award from VTAD in 2022. | Honored with the VTAD Award 2022 (VTAD = Association of Technical Analysts Germany, German branch of IFTA).   Core Features : Classic MAs
99 USD
WAPV Full MT5
Eduardo Da Costa Custodio Santos
## Opérez de manière professionnelle en utilisant WAPV Full et soyez capable de suivre où est l'argent des gros joueurs Imaginez que vous ayez entre les mains un outil qui fait seul la lecture des principaux acteurs du marché, montrant les meilleures régions commerciales sur la base d'une analyse des prix et des volumes. WAPV Full est un outil complet, 100% focalisé sur l'opérationnel de R. Wyckoff En plus de cartographier les mouvements du marché dans les vagues de négociation, il cartographie
199 USD
Hunting Trend MT5
Claudia Ramona Angerer
5 (11)
75% discount only for the first 5 buyers (3 left), main price: 300 $ Show the signal as a line graph Prediction of 10 future candles and advanced display Prediction of individual candles graphically Can be used in the gold symbol Can be used in 15 minutes time frame How the indicator works: Using complex mathematical calculations, it predicts the future 10 candles. The predictions of this indicator are based on price. Therefore, it can predict each candle separately But it is better to
75 USD
ToolBox 360 is the swiss knife of all indicators. It is full packed with useful tools to help you with your trading. It can be used to find best entry and exit points and help you to decide if you should open a trade or not. It shows market trends, candlestick formations outside / inside bars and you can sett time based allerts. Main features: Time based Fibonacci lines Choose a start and end time and the indicator shows you Fibonacci lines within the selected time range including range high
399 USD
Currency Strength Meter is the easiest way to identify strong and weak currencies. This indicator shows the relative strength of 8 major currencies + Gold: AUD, CAD, CHF, EUR, GBP, JPY, NZD, USD, XAU. Gold symbol can be changed to other symbols like XAG, XAU etc. By default the strength value is normalised to the range from 0 to 100 for RSI algorithm: The value above 60 means strong currency; The value below 40 means weak currency; This indicator needs the history data of all 28 major currency
78 USD
Plus de l'auteur
Trend Screener Pro MT5
STE S.S.COMPANY
4.87 (38)
Indicateur de tendance, solution unique révolutionnaire pour le trading et le filtrage des tendances avec toutes les fonctionnalités de tendance importantes intégrées dans un seul outil ! Il s'agit d'un indicateur multi-période et multi-devises 100 % non repeint qui peut être utilisé sur tous les symboles/instruments : forex, matières premières, crypto-monnaies, indices et actions. Trend Screener est un indicateur de suivi de tendance efficace qui fournit des signaux de tendance fléchés avec des
50 USD
Trend Screener
STE S.S.COMPANY
4.76 (59)
Indicateur de tendance, solution unique révolutionnaire pour le trading et le filtrage des tendances avec toutes les fonctionnalités de tendance importantes intégrées dans un seul outil ! Il s'agit d'un indicateur multi-période et multi-devises 100 % non repeint qui peut être utilisé sur tous les symboles/instruments : forex, matières premières, crypto-monnaies, indices et actions. Trend Screener est un indicateur de suivi de tendance efficace qui fournit des signaux de tendance fléchés avec des
50 USD
Les niveaux de support ou de résistance PR se forment lorsque l'action des prix d'un marché s'inverse et change de direction, laissant derrière lui un pic ou un creux (point de basculement) sur le marché. Les niveaux de support et de résistance peuvent créer des fourchettes de négociation. L'indicateur identifie le Swing High et le Swing Low en fonction du nombre de barres X (période) défini dans l'ensemble d'indicateurs. Remarque : Si vous aimez notre indicateur d'action sur les prix, es
FREE
Trend Monitor for MT4
STE S.S.COMPANY
4.43 (56)
Trend Monitor est un indicateur MT4 ( Metatrader 4 ) personnalisé qui analyse l'indicateur d'analyseur de tendance et de volatilité. De plus, il identifie le début et la fin de la tendance qui fonctionne pour la plupart des paires de devises et des délais. L'indicateur Trend Monitor utilise une formule optimisée basée sur l'angle moyen mobile pour calculer la volatilité de la tendance. Êtes-vous à la recherche d'un indicateur de support et de résistance bon et fiable, essayez notre indicateur
FREE
Support Resistance screnner
STE S.S.COMPANY
4.82 (28)
Support And Resistance Screener est dans un indicateur de niveau pour MetaTrader qui fournit plusieurs outils à l'intérieur d'un indicateur. Les outils disponibles sont : 1. Filtre de structure de marché. 2. Zone de repli haussier. 3. Zone de recul baissier. 4. Points pivots quotidiens 5. points pivots hebdomadaires 6. Points pivots mensuels 7. Support et résistance forts basés sur le modèle harmonique et le volume. 8. Zones au niveau de la banque. OFFRE D'UNE DURÉE LIMITÉE : L'indicateur de sup
50 USD
Notre indicateur fournira un filtre de propagation pour surveiller la propagation de plusieurs paires simultanément et également un compte à rebours de la minuterie de bougie affiche le temps restant avant la fermeture de la barre actuelle et la formation d'une nouvelle barre. OFFRE À DURÉE LIMITÉE : Tous nos indicateurs premium sont disponibles pour seulement 50$, en accédant à notre blog MQL5 vous trouverez tous les détails de nos indicateurs premium.   Cliquez ici. Principales caractéris
FREE
Support And Resistance Screener est dans un indicateur de niveau pour MetaTrader qui fournit plusieurs outils à l'intérieur d'un indicateur. Les outils disponibles sont : 1. Filtre de structure de marché. 2. Zone de repli haussier. 3. Zone de recul baissier. 4. Points pivots quotidiens 5. points pivots hebdomadaires 6. Points pivots mensuels 7. Support et résistance forts basés sur le modèle harmonique et le volume. 8. Zones au niveau de la banque. OFFRE D'UNE DURÉE LIMITÉE : L'indicateur de sup
50 USD
Trend Line Map Pro
STE S.S.COMPANY
4.69 (13)
Trend Line Map indicator is an addons for Trend Screener Indicator . It's working as a scanner for all signals generated by Trend screener ( Trend Line Signals ) . It's a Trend Line Scanner based on Trend Screener Indicator.  If you don't have Trend Screener Pro Indicator, the Trend Line Map Pro will not work. LIMITED TIME OFFER : Trend Line Map Indicator is available for only 50 $ and lifetime. ( Original price 125$ ) By accessing to our MQL5 Blog,  you can find all our premium indicators w
50 USD
Currency strength meter gives you a quick visual guide to which currencies are currently strong, and which ones are weak. The meter measures the strength of all forex cross pairs and applies calculations on them to determine the overall strength for each individual currency.We calculate based the strength of currency based on the trend of 28 pairs. LIMITED TIME OFFER : Trend CSM Indicator is available for only 50 $. ( Original price 125$ ) By accessing to our MQL5 Blog,  you can find all our
50 USD
Currency Strength Meter, gives you a quick visual guide to which currencies are currently strong, and which ones are weak. The meter measures the strength of all forex cross pairs and applies calculations on them to determine the overall strength for each individual currency. We calculate based the strength of currency based on the trend of 28 pairs. By accessing to our MQL5 Blog,  you can download the   Demo   Version of the indicator. Try it before you buy ,without the Metatrader Tester rest
50 USD
Xmaster Formula for MT5
STE S.S.COMPANY
4.25 (8)
L'indicateur de formule Xmaster analyse la tendance. De plus, il génère des signaux d'achat et de vente qui fonctionnent pour la plupart des paires de devises et des délais. En conclusion, nous avons optimisé la formule de Xmaster pour qu'elle soit plus précise en ajoutant un analyseur de volatilité et une analyse multi-période. OFFRE À DURÉE LIMITÉE : Tous nos indicateurs premium sont disponibles pour seulement 50$, en accédant à notre blog MQL5 vous trouverez tous les détails de nos indic
FREE
L'indicateur Boom and Crash Spike Detector est codé sur la base d'une stratégie avancée principalement pour détecter le Boom and Crash dans les prix. Des algorithmes complexes ont été implantés pour détecter les booms et les crashs à haute probabilité dans les prix. Il alerte sur d'éventuelles phases de Boom ou crash : Phase de Boom : Lorsque le prix augmente trop vite. Crash Phase : Lorsque le prix baisse trop vite. OFFRE À DURÉE LIMITÉE : L'indicateur est disponible pour seulement 50 $ et
50 USD
This indicator is intended to assist in the backtesting process. It can be used to highlight time zone session   based on your time setting   in which you are either asleep or away from your charts, or intraday trading sessions that you want to trade. It will help you to monitor the market move during a period of time. Key features Selecting trading zone time ( Beginning and ending time ) Highlight the trading zone ( Highest High and Lowest low of that specified session ) 100% free indicator
FREE
L'analyseur de volatilité est un indicateur de momentum, qui capitalise sur la tendance des prix à éclater fortement après s'être consolidés dans une fourchette de négociation étroite. L'indicateur utilise également un oscillateur de momentum pour montrer la direction attendue du mouvement lorsque la compression se déclenche. Cet histogramme oscille autour de la ligne zéro, l'augmentation de l'élan au-dessus de la ligne zéro indique une opportunité d'achat long, tandis que l'élan tombant en des
50 USD
Trend Monitor for MT5
STE S.S.COMPANY
4.44 (18)
Trend Monitor est un indicateur MT4 ( Metatrader 4 ) personnalisé qui analyse l'indicateur d'analyseur de tendance et de volatilité. De plus, il identifie le début et la fin de la tendance qui fonctionne pour la plupart des paires de devises et des délais. L'indicateur Trend Monitor utilise une formule optimisée basée sur l'angle moyen mobile pour calculer la volatilité de la tendance. Êtes-vous à la recherche d'un indicateur de support et de résistance bon et fiable, essayez notre indicateur
FREE
Pin Bar Detector est un indicateur qui trouve le modèle d'action des prix Pin Bars sur le graphique. Pin Bars est un raccourci pour "Pinocchio Bars" qui est une alternative classique aux chandeliers japonais avec de grandes ombres supérieures ou inférieures et de très petits corps comme Dragon Fly Doji, Grave Stone Doji, Hammer, Inverted-Hammer, Hanging Man et Shooting Star . OFFRE À DURÉE LIMITÉE : L'indicateur est disponible pour seulement 50 $ et à vie. (Prix d'origine 125$) Principales
FREE
Notre indicateur fournira un filtre de propagation pour surveiller la propagation de plusieurs paires simultanément et également un compte à rebours de la minuterie de bougie affiche le temps restant avant la fermeture de la barre actuelle et la formation d'une nouvelle barre. OFFRE À DURÉE LIMITÉE : Tous nos indicateurs premium sont disponibles pour seulement 50$, en accédant à notre blog MQL5 vous trouverez tous les détails de nos indicateurs premium. Cliquez ici. Principales caractéristi
FREE
L'indicateur de formule Xmaster analyse la tendance. De plus, il génère des signaux d'achat et de vente qui fonctionnent pour la plupart des paires de devises et des délais. En conclusion, nous avons optimisé la formule de Xmaster pour qu'elle soit plus précise en ajoutant un analyseur de volatilité et une analyse multi-période. OFFRE À DURÉE LIMITÉE : Tous nos indicateurs premium sont disponibles pour seulement 50$, en accédant à notre blog MQL5 vous trouverez tous les détails de nos indic
FREE
This indicator is intended to assist in the backtesting process. It can be used to highlight time zone session based on your time setting in which you are either asleep or away from your charts, or intraday trading sessions that you want to trade. It will help you to monitor the market move during a period of time. Key features Selecting trading zone time ( Beginning and ending time ) Highlight the trading zone ( Highest High and Lowest low of that specified session ) 100% free indicator. Wor
FREE
Pin Bar Detector est un indicateur qui trouve le modèle d'action des prix Pin Bars sur le graphique. Pin Bars est un raccourci pour "Pinocchio Bars" qui est une alternative classique aux chandeliers japonais avec de grandes ombres supérieures ou inférieures et de très petits corps comme Dragon Fly Doji, Grave Stone Doji, Hammer, Inverted-Hammer, Hanging Man et Shooting Star . OFFRE À DURÉE LIMITÉE : L'indicateur est disponible pour seulement 50 $ et à vie. (Prix d'origine 125$) Principales
FREE
A tool that analyzes the trades performance and gives all necessary ratios to analyze accounts history. Trade Analyzer for MT4 has 2 main features :  Display Account Analysis in the main chart with a screener. Generate CSV document with all closed trades performance.  LIMITED TIME OFFER : Trades Analyzer is available for only 50 $ and lifetime. ( Original price 125$ ) Key features Screener to Display Trades Performance. Analyze Trades Per Magic Number, Per Symbol or Per Comments. Export t
50 USD
Une implémentation personnelle du modèle Higher High et Lower Low. Le trader doit entrer sur le marché ou rechercher des transactions dans la direction du marché, nous avons créé et optimisé ce modèle plus haut et plus bas pour être plus précis. La structure du marché est composée principalement de 2 modèles importants : Plus haut : lorsque le prix atteint un plus haut et que le prix continue d'augmenter en fonction de ce modèle. Plus bas : lorsque le prix atteint un plus bas et que le prix
50 USD
La plage quotidienne moyenne montre la plage de pip moyenne d'une paire Forex mesurée sur un certain nombre de périodes. Les traders peuvent utiliser l'ADR pour visualiser l'action potentielle des prix en dehors du mouvement quotidien moyen. Lorsque l'ADR est supérieur à la moyenne, cela signifie que la volatilité quotidienne est plus élevée que d'habitude, ce qui implique que la paire de devises peut s'étendre au-delà de sa norme. Notre ADR Analyzer est composé de 5 fonctionnalités principal
50 USD
L'indicateur Boom and Crash Spike Detector est codé sur la base d'une stratégie avancée principalement pour détecter le Boom and Crash dans les prix. Des algorithmes complexes ont été implantés pour détecter les booms et les crashs à haute probabilité dans les prix. Il alerte sur d'éventuelles phases de Boom ou crash : Phase de Boom : Lorsque le prix augmente trop vite. Crash Phase : Lorsque le prix baisse trop vite. OFFRE À DURÉE LIMITÉE : L'indicateur est disponible pour seulement 50 $ et
50 USD
Chaque commerçant sait qu'il ne devrait jamais risquer plus de 5% (ou 7%) par transaction. Il s'agit d'une loi de gestion de l'argent et une taille de lot utilisable doit être calculée à chaque fois car un trader doit utiliser une valeur StopLoss différente pour différents niveaux de trading. Cet indicateur calculera un LotSize approprié pour le moment où vous le mettrez sur le graphique et chaque fois que vous ferez glisser la "Stop Loss Line" dans n'importe quelle direction. OFFRE À DURÉE
50 USD
La plage quotidienne moyenne montre la plage de pip moyenne d'une paire Forex mesurée sur un certain nombre de périodes. Les traders peuvent utiliser l'ADR pour visualiser l'action potentielle des prix en dehors du mouvement quotidien moyen. Lorsque l'ADR est supérieur à la moyenne, cela signifie que la volatilité quotidienne est plus élevée que d'habitude, ce qui implique que la paire de devises peut s'étendre au-delà de sa norme. Notre ADR Analyzer est composé de 5 fonctionnalités principal
50 USD
L'analyseur de volatilité est un indicateur de momentum, qui capitalise sur la tendance des prix à éclater fortement après s'être consolidés dans une fourchette de négociation étroite. L'indicateur utilise également un oscillateur de momentum pour montrer la direction attendue du mouvement lorsque la compression se déclenche. Cet histogramme oscille autour de la ligne zéro, l'augmentation de l'élan au-dessus de la ligne zéro indique une opportunité d'achat long, tandis que l'élan tombant en des
50 USD
Filtrer:
JCJ
556
JCJ 2023.04.03 02:48 
 

Nice add on to the trend screener pro

T.J.Sch_318798
216
T.J.Sch_318798 2023.03.02 18:33 
 

This indicator is excellent. It greatly helps you to identify great teading oportunities & trend predictor helps correctly predict the trend and avoid traps. The service provided by Sayadi is amazing. This & trend predictor are excellent choice for having great - safe trading.

pdev
556
pdev 2023.02.06 08:35 
 

Great indicator and an indispensable add-on for trend screener indicator. Very helpful and responsive seller

Johan Ferdianto
135
Johan Ferdianto 2022.03.05 18:35 
 

I already have version for MT4, I complete for MT5 too. Great job, good Indicator

Maungfortrading
249
Maungfortrading 2022.02.08 14:15 
 

Best Indicator !!

caichenyi
106
caichenyi 2021.09.06 14:51 
 

I try to run `Trend Screener Pro` and `Trend Line Map` in MT5 at the same time. It can only run for a short time about 15 mins, then the 2 Indicators wouldn't update and the Chart will freeze.

If I close `Trend Line Map`, it works normally.

please help to check this issue. this issue block uses these indicators.

Besides, It's only V5.10, the version is so low than MT4(Trend Line Map).

STE S.S.COMPANY
447769
Réponse du développeur Sayadi Achraf 2021.09.09 18:26
Hi sir. Thank you for your review. You can't attach 2 screeners in the same chart, you need to have one screener per chart sir. Example :
1. Chart 1 => Trend Screener Pro
2. Chart 2 => Trend Line Map Pro. In this way, you can run both 2 indicators sir to analyze the trend, sir. Please if you have any questions, feel free to contact me, sir. Imporant Note :
- MT4 version is faster because MT4 is much faster in managing multi-currencies data than MT5 sir. - Please make sure that you have historical data available to make the indicator much faster in loading signals. It's a signal calculator and not a simple indicator sir. Best regards.
SAYADI Ashref.
Crypto King
177
Crypto King 2021.01.17 09:08 
 

Another Great product from Mr. Sayadi ! Thank you.

STE S.S.COMPANY
447769
Réponse du développeur Sayadi Achraf 2021.01.17 09:30
Thx u sir.
Répondre à l'avis
Version 6.20 2023.01.13
1. Improve indicator performance and calculation speed.
2. Add the Update Frequency parameter in seconds.
Version 6.11 2022.04.27
1. Optimizing indicator speed for low computer CPU.
Version 6.0 2021.09.22
1. Fixing issue of wrong signals based Trend Screener Pro Indicator.
2. Optimizing the indicator to the last MT5 versions to make more faster.
------------------

Highly recommended to upgrade to the last version of the Trend Line Map indicator.