Neue Handelsroboter und Indikatoren für den MetaTrader 5 - 172
MT5 to Telegram Pro/Copier ist ein leistungsstarker MetaTrader 5 Expert Advisor, der entwickelt wurde, um Ihr Trading-Erlebnis zu verbessern, indem er Echtzeit-Handelsbenachrichtigungen und umfassende Berichte über die Telegram-Messaging-Plattform sendet. Ideal für Signalgeber und Trainer, kopiert dieses Tool manuell oder durch andere EAs platzierte Trades in Ihrem Konto und bietet anpassbare Warnungen, fortschrittliches Handelsmanagement und ein benutzerfreundliches Dashboard für Performance-Ei

Flora Willkommen in einer neuen Ära des Handels. Flora ist nicht nur ein weiterer EA – es ist eine komplexe Lösung, die Ihnen einen Vorteil in den ständig sich entwickelnden Märkten verschafft. Basierend auf einem fortschrittlichen Rahmen kombiniert dieser Expert Advisor modernste Strategien mit innovativen Risikomanagementsystemen, die es Ihnen ermöglichen, mit Vertrauen und Präzision zu handeln. Request a demo-exclusive trial by contacting me directly. Early access pricing: 89. Just 4 users h

Der Nro Lines Indikator bietet durch Linienzeichnung eine präzise und dynamische Visualisierung der wichtigsten Preisniveaus. Diese Funktionalität ermöglicht es Händlern, eine optimierte technische Analyse durchzuführen, was für die Entwicklung effektiver Handelsstrategien und die Treffsicherheit von Marktein- und -ausstiegsentscheidungen unerlässlich ist. Hauptfunktionen: - Dynamische Referenzlinien, die sich den Marktveränderungen anpassen und dem Händler eine aktuelle und relevante visuelle

Executor AI Ultra X ist ein Expert Advisor, der für den algorithmischen Handel auf dem Goldmarkt entwickelt wurde und drei unabhängige Handelsstrategien verwendet. Seine Architektur integriert fortschrittliche Deep-Learning-Algorithmen wie Deep Q-Learning (DQN) und Time-Delay-Neuronale Netze (TDNN), was eine hohe Anpassungsfähigkeit und analytische Präzision bietet. DQN , das auf Techniken des Reinforcement Learning basiert, optimiert die Entscheidungsalgorithmen durch die Simulation historische

Willkommen Gold-Excel-Berater Für MetaTrader5 ist dies die perfekte Lösung für den automatischen Handel mit dem Finanzinstrument XAUUSD (GOLD). Seitdem hat unser System seine Leistungsfähigkeit unter Berücksichtigung der Buchhaltungsverfahren unter Beweis gestellt. 1.000 bis 34.000 USD Erreichen Sie bis 2024 eine 5-Sterne-Leistung.
GoldExcel war in den letzten 12 Monaten konstant profitabel und ist eine zuverlässige Option in der Handelswelt. Erleben Sie die Leistungsfä
SEREDINA ist Ihr vielseitiges Werkzeug zur Bewertung und Kontrolle von Positionen! Dieses Skript berechnet automatisch den Durchschnittspreis der offenen Kauf- (BUY) und Verkaufspositionen (SELL) für jedes Handelsinstrument auf der MetaTrader 5-Plattform und zeigt nicht nur präzise Daten, sondern auch visuelle Ebenen im Chart an, die Ihnen sofort das durchschnittliche Einstiegsniveau Ihrer Positionen verdeutlichen. Mit SEREDINA können Sie: Den "Durchschnittspreis" für offene BUY- und SELL-Orders

Der Trendrisikoindikator PRT findet trendige Teile der Preisbewegung und zeigt das Vorhandensein eines Trends durch einen Wert im Puffer an.
Kann für Flat-Trading verwendet werden, um den Handel zu deaktivieren, wenn die Möglichkeit besteht, dass der Preis den Kanal verlässt (empfohlen für D1), in dem Trades durchgeführt werden.
Er hat zwei Eingabeparameter:
• Bandbereich – Berechnungsbereich der Bänder
• Abweichung – der Abweichungswert (die Breite des zulässigen Kanals)

GANNMACD ist ein Expert Advisor (EA) für MetaTrader 5 (MT5), der zwei technische Analyse-Strategien kombiniert: den MACD (Moving Average Convergence Divergence) und die Gann-Niveaus. Das Tool verwendet diese Indikatoren, um Kauf- und Verkaufsbedingungen zu erkennen und basierend auf anpassbaren Einstellungen automatisch Orders auszuführen. Hauptfunktionen: MACD : Der MACD-Indikator wird verwendet, um Kauf- und Verkaufssignale zu generieren. Das Skript vergleicht die Hauptlinie des MACD mit der S

Fireman Krypto-Bot Der Fireman Krypto-Bot ist eine hochmoderne, KI-gesteuerte Kryptowährungs-Handelslösung, die entwickelt wurde, um zuverlässige und profitable Handelsergebnisse zu liefern. Dieser Bot wurde von einem Team erfahrener Händler und quantitativer Analysten entwickelt und nutzt fortschrittliche maschinelle Lernverfahren und Technologien zur Verarbeitung natürlicher Sprache. Er nutzt die Fähigkeiten von GPT-4, dem modernsten Sprachmodell von OpenAI, um umfangreiche Marktdaten zu anal

Elevate your trading game with TheGhost . Engineered for traders who demand excellence, TheGhost combines cutting-edge algorithms with meticulous coding to deliver exceptional profitability and unmatched performance in the dynamic world of financial markets. Key Features: Comprehensive Risk Management
Protect your investments with TheGhost’s sophisticated risk management protocols. Automated Trade Execution
Eliminate emotional trading and ensure swift execution with TheGhost’s fully automated

Predator Order Manager-
Merkmale:
- Kauf- und Verkaufsaufträge: Führen Sie mühelos Marktaufträge mit einem einzigen Klick aus.
- Limit Orders: Legen Sie Ihre Buy-Limit- und Sell-Limit-Orders fest, um von Marktbewegungen zu den von Ihnen bevorzugten Preispunkten zu profitieren.
- Stop-Orders: Nutzen Sie Buy Stop- und Sell Stop-Orders, um bei Ausbruchsniveaus in den Handel einzusteigen, damit Sie keine Gelegenheit verpassen. - Die Instant-Breakeven-Funktion verschiebt das Stop-Niveau zum Breakev

Der Range Breakout Expert Advisor ist eine professionelle Handelslösung, die von Intraday-Ausbruchschancen profitiert. Im Gegensatz zu vielen anderen EAs, die sich auf komplexe Raster- oder Martingale-Strategien stützen, verfolgt dieser EA einen klaren, logischen Ansatz zur Marktdynamik.
Bitte hinterlassen Sie eine Bewertung, wenn dieses Tool für Sie nützlich ist. Vielen Dank! :)
Hauptmerkmale: - Zeitbasierte Bereichsberechnung für präzise Einstiegspunkte - Risikobasierte Positionsgrößenbere
FREE

Smart Volume Box wurde entwickelt, um MetaTrader-Benutzern ein leistungsfähiges Analysewerkzeug an die Hand zu geben, mit dem sie die versteckte Dynamik des Marktes aufdecken können. Dieses präzisionsgefertigte Tool mit benutzerfreundlichen Einstellungen integriert wichtige Einblicke in das Volumen und fortschrittliche Funktionen wie Volumenprofil, VWAP (volumengewichteter Durchschnittspreis) und Point of Control (POC)-Level. Im Gegensatz zu typischen Indikatoren liefert Smart Volume Box keine

Hier ist die deutsche Übersetzung: Black Bull Gold – Ihr Vorteil auf den XAUUSDm- oder XAUUSD-Märkten Einführung in Black Bull Gold , ein fortschrittlicher, auf technischer Analyse basierender Expert Advisor (EA), der speziell für den Hochfrequenzhandel (HFT) auf XAUUSD und DE30 entwickelt wurde. Dieser EA nutzt ausgeklügelte Algorithmen und Echtzeit-Marktdaten, um die Handelsergebnisse zu optimieren und Händlern zu helfen, sich in der hohen Volatilität dieser Märkte zurechtzufinden. Hauptmerkma
FREE

Preis-Aktion-Super-Roboter UPDATED VERSION 1.4 mit zahlreichen Verbesserungen !
Link zu Anleitung und Benutzerhandbuch Bevor Sie die kostenlose Demoversion dieses EA ausführen, vergewissern Sie sich, dass Ihre Kontogröße mit dem Parameter für die anfängliche Einzahlung (RM0) in der von Ihnen verwendeten Set-Datei übereinstimmt. Dies ist ein Preis-Aktions-Expertenberater, der Muster wie Doji, Engulfing, Reversal, Gaps, Fraktale und mehr erkennt, um Einstiegspreise und Timing zu bestimmen. Er ha

Position Accelerator ist eine innovative Lösung für Händler, die dabei hilft, die Gewinne zu maximieren, indem sie von den Trends der Marktbewegungen profitiert. Das Dienstprogramm erhöht automatisch die Größe Ihrer Handelspositionen, sobald diese ein vordefiniertes Gewinnniveau erreicht haben, wodurch Ihre Rentabilität erheblich gesteigert wird. Dieses Produkt ist auch für MetaTrader 4 => https://www.mql5.com/en/market/product/126703 erhältlich . Wie funktioniert Position Accelerator? 1. Besch

Der Indikator färbt die Kerzen relativ zu ihrem Volumen-Delta. Die Berechnung des Kerzendeltas basiert auf der Tick-Historie oder auf der Transaktionsband-Historie (siehe unten für eine Beschreibung der Eingabevariablen "Volumes").
Die Einfärbung erfolgt über zwei Parameter : nach dem Delta-Vorzeichen, als Kerzenfarbe, nach dem Delta-Wert, als Kerzenfarbe im Kontrast zur Hintergrundfarbe des Chart-Fensters.
Zusätzlich zur Einfärbung der Kerzen zeigt der Indikator auch das Delta-Profil in dem

LogEverything EA
Der LogEverything EA ist ein umfassendes Tool zur Protokollierung und Aufzeichnung verschiedener Handelsmetriken, Kontoinformationen und Marktdaten. Es ist eine robuste Lösung für Trader, die die Performance ihrer Trades verfolgen, historische Daten analysieren und eine genaue Aufzeichnung sicherstellen möchten.
Hauptmerkmale: Protokolliert Handelsausführungen, einschließlich Details wie Einstiegskurs, Losgröße, Stop Loss, Take Profit und Kommentare.
Verfolgt geschlossene Tra

Treffen Sie Nova Trading Bot
Nova ist ein leistungsstarkes automatisches Handelssystem, das Hedge- und Grid-Strategien kombiniert. Es passt sich intelligent an die Marktbedingungen an und verwaltet Ihre Trades mit Disziplin, Präzision und Effizienz - alles in Ihrem Namen. Hauptmerkmale, die Ihnen einen Vorsprung verschaffen: Hybride Strategie: Nova verschmilzt Hedge- und Grid-Mechanismen zu einer ausgewogenen und effektiven Struktur. Die Strategie ist zwar für AUD-Paare (mit Schwerpunkt auf AU
ADX-basierter Kerzenfarben-Indikator für MT5
Beschreibung : Verbessern Sie Ihre Handelserfahrung mit dem ADX-basierten Candle Color Indicator für MT5! Dieses leistungsstarke Tool färbt Candlesticks auf der Grundlage des Average Directional Index (ADX) Indikators und hilft Ihnen, die Marktstärke und -richtung auf einen Blick zu erkennen.
Hauptmerkmale : - Farbcodierte Candles: - Grün (bullisch), wenn D+ > D-. - Rot (bärisch), wenn D- > D+. - Intensitäts-Mapping: Die Farbintensität spiegelt den
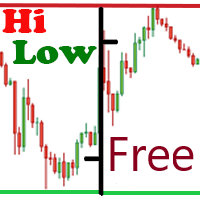
Die kostenlose Version des Hi Low Last Day Indikators . Der Indikator Hi Low Levels Last Day zeigt das Hoch und Tief des letzten Handelstages . Sie haben die Möglichkeit , die Farbe der Linien zu ändern . Testen Sie die vollständige Version des Hi Low Last Day Indikators , in der zusätzliche Indikator Funktionen zur Verfügung stehen : Anzeige des Minimums und des Maximums des vorletzten Tages Anzeige des Minimums und des Maximums der vorangegangenen Woche Tonsignal beim Überschreiten von max . u
FREE

Long & Short EA für Forex - MetaTrader 5 Link, um zu verstehen, wie die Parametrisierung und das Kontrollpanel funktionieren: mql5.com/pt/blogs/post/759824 Dieser Expert Advisor (EA) wurde entwickelt, um Long & Short-Operationen auf dem Forex-Markt über den MetaTrader 5 durchzuführen. Er kann sowohl im Day Trade- als auch im Swing Trade-Format arbeiten. Er automatisiert die Identifizierung von Handelsmöglichkeiten zwischen zwei Währungspaaren (Symbol 1 und Symbol 2), indem er Preisschwankungen z
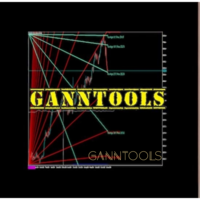
GannTools-Indikator
Der GannTools-Indikator ist ein leistungsstarkes Handelsinstrument, das von den Strategien von W.D. Gann inspiriert wurde. Dieser Indikator bietet Händlern dynamische Unterstützungs- und Widerstandsniveaus, Trendanalysen und wichtige Preismuster unter Verwendung von Gann-Winkeln und -Zyklen. Hauptmerkmale: Anpassbare Gann-Fächer, -Winkel und -Zyklen für eine präzise Marktanalyse. Automatische Identifizierung von wichtigen Kursniveaus und Trendrichtungen. Funktioniert auf al

Skript zur schnellen Aktualisierung (Synchronisation) der Handelshistorie in der SQLite-Datenbank. Speichert geschlossene Positionen und Aufträge, Symboldaten.
Nutzen Sie die Möglichkeiten von SQLite für die Zwischenspeicherung von Daten, Analysen und Integrationen der MetaTrader-Plattform. Bewahren Sie alle Ihre Daten an einem Ort auf.
Verwenden Sie die gespeicherten Daten in analytischen SQL-Abfragen, aus Python und anderen Sprachen, um Dashboards zu erstellen.
Parameter useDefaults true -
FREE

BLACKROCK DYNAMICS ist ein völlig automatischer Verkäufer mit geringem Arbeitsaufwand. Sie benötigen keine Handelserfahrung, um das Programm zu nutzen, sondern können es einfach auf Ihrem PC installieren und herunterladen. Der ASEROR EXPERTO in dieser einfachen Version verwendet 4 Filter und Anzeigen, um einen Kauf oder eine Veräußerung zu realisieren. Der Hauptbestätigungsfilter ist ein modifizierter RSI, sowie 2 ADX-Filter mit unterschiedlichen Zeiträumen. In unserer Arbeit verwenden wir den
FREE

Das Skript analysiert alle Handelsinstrumente, die im Market Watch der MT5-Plattform aufgeführt sind, um ihre Eignung für den Handel in den in den Einstellungen festgelegten Zeitrahmen zu bewerten. Auf der Grundlage der Analyse zeigt das Skript eine Tabelle an, in der Handelsinstrumente, die für den Handel geeignet sind und empfohlen werden, auf der Grundlage ihrer Übereinstimmung mit dem Koeffizienten des Risiko-Ertrags-Verhältnisses, einschließlich des Spreads (Standardwert 1:3), grün markiert
FREE
Skript zur schnellen Aktualisierung (Synchronisation) aktueller Daten in der SQLite-Datenbank. Speichert offene Positionen und Aufträge, aktuelle Notierungen.
Nutzen Sie die Möglichkeiten von SQLite für die Zwischenspeicherung von Daten, Analysen und Integrationen der MetaTrader-Plattform. Bewahren Sie alle Ihre Daten an einem Ort auf.
Verwenden Sie die gespeicherten Daten in analytischen SQL-Abfragen, aus Python und anderen Sprachen, um Dashboards zu erstellen.
Parameter useDefaults true -
FREE

Vollautomatischer Advisor für das Währungspaar USDJPY . Zeitrahmen H1 . Dieser Advisor ist ein zusätzlicher Advisor zu meinem Basis-Advisor-Portfolio, das aus folgenden besteht EA Dance GBPJPY ;
EA Golden Dance ;
EA Dance BTC ; ... (Ergänzungen sind zu erwarten)
Eigenschaften des Advisors : Der Advisor besteht aus fünf kleinen Advisors, jeder mit seiner eigenen Logik für den Einstieg in einen Handel. Der Advisor wartet nur auf die stärksten Einstiegssignale, so dass Trades recht selten sind.

Vollautomatischer Advisor für das Währungspaar EURUSD . Zeitrahmen m30 .
Dieser Advisor ist ein zusätzlicher Advisor zu meinem Basis-Advisor-Portfolio, das aus folgenden besteht EA Dance GBPJPY ; EA Golden Dance ; EA Dance BTC ; ... (Ergänzungen sind zu erwarten) Eigenschaften des Advisors: Der Adviser besteht aus fünf kleinen Advisern, von denen jeder seine eigene Logik für den Einstieg in einen Handel hat. Der Adviser wartet nur auf die stärksten Signale, um in den Handel einzusteigen, so da

G-Labs Market Maker Dashboard MT5 | BTMM Scanner mit Peak Formation, ADR Cycles und Asian Range Echtzeit Multi-Currency Market Maker Scanner für MetaTrader 5. Verfolgt BTMM-Peak-Formationen , asiatische Sitzungsspannen, ADR-Zyklusverläufe , Stop-Hunt-Aktivitäten, Zyklusprojektionen und RSI-Entry-Timing für mehr als 28 Paare über ein einziges Dashboard . Das BTMM-Dashboard der Einstiegsklasse für Trader, die die Banks Track Market Maker-Methode erlernen und anwenden möchten . Liefert alle wichtig

Hurst Cycles Diamanten Beschreibung Dieser Indikator ist eine alternative Version, die von der Pionierarbeit von David Hickson und dem von Grafton entwickelten Indikator Hurst Cycles Notes inspiriert ist. Das Hauptziel besteht darin, eine klare und intuitive Sicht auf die Hurst-Zyklen zu bieten. Impressum Ursprüngliches Konzept : David Hickson - Hurst-Zyklen-Theorie Inspiration : Grafton - Hurst-Diamant-Notation Pivots Alternative Version : Fillipe dos Santos Wichtigste Merkmale Identifiziert u

Der Daily Ranger USTEC Ultimate EA ist ein Intraday-Handelssystem, das entwickelt wurde, um das volle Potenzial der ausgeprägten Intraday-Volatilität des Nasdaq-Index (auch bekannt als USTEC, US100, NAS100, NQ100) zu nutzen. Der EA handelt während der New Yorker Handelssession und nimmt maximal 2 hochwertige Intraday-Trades mit SL und TP auf. KEIN RASTER, KEIN MARTINGAL, KEIN HINZUFÜGEN VON VERLIERERN Der EA wird mit echten Tickdaten getestet, die genaueste Art, einen EA zu testen. Wählen Sie Ih

NeonKumo
NeonKumo ist ein unkompliziertes und zuverlässiges Handelssystem, das auf Einfachheit und Präzision ausgerichtet ist. Dieser EA basiert auf dem Ichimoku-Indikator und wertet den Markt sorgfältig aus, um potenzielle Trades klar zu identifizieren. NeonKumo zielt nicht darauf ab, übermäßig kompliziert zu sein; stattdessen nutzt es die Kraft der klaren Erkenntnisse von Ichimoku für Händler, die nach einer ausgewogenen, schnörkellosen Lösung für den Devisenmarkt suchen. NeonKumo wurde entwi

Symbol: EURUSD Zeitrahmen:M15 Empfohlen: M15 Keine gefährlichen Strategien Fester Stop-Loss Empfohlene Einstellungen: deafult Mehrere Strategien Empfohlene Losgröße: Einzahlung Losgröße 1000€. 0.01 2000€. 0.02 5000€. 0.05 10000€. 0.1 Backtest 2020-2024 bis jetzt Bitte nutzen Sie gutes Risiko- und Geldmanagement Geld- und Kontosicherungen möglich Wenn Sie Hilfe oder andere Empfehlungen benötigen, fragen Sie mich bitte Mehr Informationen: https: //www.mql5.com/en/users/martin6223 Sehen Sie sich me
FREE

Golden Vulture EA
Expert Advisor für XAUUSD (Gold), DE30 (Deutscher DAX-Index), und US30 Golden Vulture EA ist ein Handelsalgorithmus, der entwickelt wurde, um Handelsstrategien für XAUUSD (Gold), DE30 (deutscher DAX Index) und US30 zu automatisieren. Dieser Expert Advisor nutzt spezifische Marktbedingungen, um Einstiegs- und Ausstiegssignale zu generieren, das Risiko durch automatische Stop-Loss-Platzierung zu steuern und einen Trailing-Stop-Mechanismus zu implementieren. Wichtig: Dieser EA i

Gleitender Durchschnitt mit Bollinger Bändern Allgemeine Informationen: Der Indikator kombiniert zwei beliebte Instrumente der technischen Analyse: Gleitende Durchschnitte (einfacher gleitender Durchschnitt und geglätteter gleitender Durchschnitt), um den Trend zu bewerten. Bollinger Bands zur Analyse der Marktvolatilität. Hauptkomponenten: SMA (Einfacher gleitender Durchschnitt): Der einfache gleitende Durchschnitt wird als arithmetisches Mittel der Kurse über einen bestimmten Zeitraum berechne
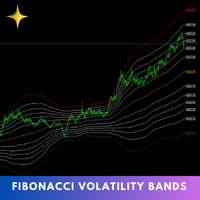
Der Fibonacci-Volatilitätsband-Indikator ist ein verfeinertes Instrument zur Verbesserung Ihrer Marktanalyse durch die Integration von Fibonacci-Retracements mit dem Bollinger-Band-Konzept. Dieser Indikator hebt potenzielle Unterstützungs- und Widerstandsbereiche visuell hervor und bietet Händlern ein klareres Verständnis von Kursschwankungen und Volatilität. MT4-Version - https://www.mql5.com/en/market/product/126421/ Der Kern der Fibonacci Volatility Bands basiert auf einem volumengewichteten
FREE

Rabatt 50% für 20 Erstkunden
Dieses Handelssystem von Scarface Trades. Dieser Experte verwendet keine gefährliche martingale, Gitter, haben stoploss und tp, empfohlen, 1% Risiko und 1:2 RR Ratio verwenden. Das beste Paar ist Tesla, ich benutze icmarkets zu backtest. Es scannt die 5-minütige Eröffnungsspanne und definiert nach dem Ausbruch aus der Eröffnungsspanne einen Orderblock, der beim erneuten Test des Orderblocks die Position übernimmt. Bisher habe ich backtested nur Tesla machen einen g
FREE
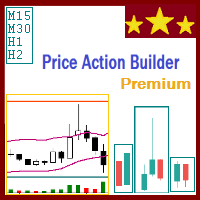
Der Price Action Builder Premium Expert Advisor ist eine Erweiterung des frei verfügbaren Price Action Builder Basic :
er bietet 2 neue Candlestick-Muster neben der Pinbar (die bereits in der Basisversion verfügbar ist); In den meisten Konfigurationen zeigt das Backtesting in der Regel eine um ca. 50% höhere durchschnittliche jährliche Rendite; Die Wachstumskurve des Kontos ist aufgrund der größeren Anzahl von Trades, die sich im Vergleich zur kostenlosen Version fast verdoppelt (2x), ebenfalls

Dieses Programm dient zum Herunterladen von Wirtschaftsnachrichten für ein bestimmtes Land über einen ausgewählten Datumsbereich, so dass Händler wichtige Wirtschaftsdaten analysieren und in ihre Handelsstrategien einbeziehen können. Durch die Angabe eines Start- und Enddatums sowie eines Ländercodes ruft das Programm relevante Nachrichtenereignisse innerhalb des definierten Zeitraums ab und exportiert sie zur einfachen Überprüfung und Analyse in eine CSV-Datei. Dieses Tool hilft Händlern, über
FREE

PathFinder Trend EA ist ein automatisiertes Handelssystem, das die Signallogik des PathFinder Trend Indikators nutzt. Der EA ermöglicht ein flexibles Handelsmanagement mit Optionen zum Festlegen von zwei Take-Profit-Levels (TP1 und TP2) und einem Stop-Loss (SL), mit dem Sie den Handel auch bei einem umgekehrten Signal schließen können. Diese Levels werden über die Eingabeparameter des EA konfiguriert, wobei die TP-Markierungen auf dem Chart als kurze horizontale Linien erscheinen. Der EA verfügt
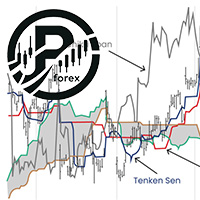
Funktionalitäten - Offene Kauf- und Verkaufsaufträge nach Ichimoku - Anpassbarer Break-Even UND TP SL - Implementiert Martingale-Funktionen
Empfehlungen - Währungspaare: Wichtige Währungspaare - Empfohlene Währungspaare: EURUSD - Nicht empfohlen: XAUUSD - Zeitrahmen: 15M / 1H - Mindesteinlage: $2000 pro Währungspaar *Empfohlen $10000 - Hebelwirkung: Minimum 1:100, empfohlen 1:500 - Konto-Typ: ECN, Raw, oder Razor mit sehr niedrigen Spreads. - Verwenden Sie einen VPS für den EA, um 24/7 zu arbe

MT5 Auto Trading von Gold : Market Struture(Key Level) und Liquidity Breakout Strategy
Echtzeit Signal Flowcon: https: //www.mql5.com/en/signals/2308343
Die wichtigsten Funktionen umfassen: Breakout Trading - Smart Money Konzept: Identifiziert automatisch die Nachfrage- und Angebotszonen an den Höchst- und Tiefstständen und zielt auf die kritischsten Marktniveaus. Risiko- und Auftragsmanagement: Progressive und flexible Losgrößen mit konsistenten Take-Profits und Stop-Loss gewährleisten ei
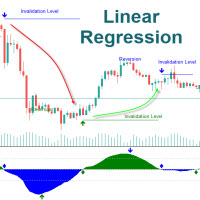
Der Linear Regression Oscillator (LRO) ist ein technischer Indikator, der auf der linearen Regressionsanalyse beruht und auf den Finanzmärkten häufig zur Beurteilung der Dynamik und der Richtung von Kurstrends verwendet wird. Er misst den Abstand zwischen dem aktuellen Kurs und dem Wert, der von einer linearen Regressionslinie vorhergesagt wird, d. h. der Linie mit der besten Anpassung über einen bestimmten Zeitraum. Im Folgenden werden seine Funktionsweise und seine Komponenten erläutert: Haupt
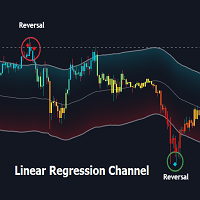
Überblick:
Der Linear Regression Channel Indicator ist ein vielseitiges Tool für Metatrader, das Händlern hilft, Preistrends und potenzielle Umkehrpunkte zu visualisieren. Durch die Berechnung und Darstellung von linearen Regressionskanälen, Bändern und Zukunftsprojektionen bietet dieser Indikator umfassende Einblicke in die Marktdynamik. Er kann überkaufte und überverkaufte Bedingungen hervorheben, die Trendrichtung identifizieren und visuelle Hinweise auf zukünftige Kursbewegungen geben.
Ha

Beschreibung :
Der Indikator "MVRV by Age Approximation" bietet Händlern eine einzigartige Visualisierung des Verhältnisses von Marktwert zu realisiertem Wert (MVRV) auf dem Chart, segmentiert nach Haltezeiträumen oder "Alterskohorten". Dieser Indikator dient der Annäherung an die MVRV-Metrik, indem er Vermögenswerte in kurzfristige, mittelfristige und langfristige Inhaber kategorisiert und so einen klaren Überblick über den relativen nicht realisierten Gewinn oder Verlust über verschiedene Halt

Super Euro FX ist ein Expert Advisor, der speziell für das Währungspaar EURUSD auf dem H1-Zeitrahmen entwickelt wurde. Seine zentrale Design-Philosophie dreht sich darum, eine hohe Gewinnrate zu erzielen und gleichzeitig fortschrittliche Risikomanagement-Protokolle zu integrieren, um den geringstmöglichen Drawdown im Verhältnis zu seiner Leistung zu erhalten. Das System wird von einer komplexen Engine angetrieben, die 225 verschiedene Handelsstrategien ausführt. Dieser Multi-Strategie-Ansatz er

Der Benjan Expert ist ein vollautomatischer Handelsroboter. Der Roboter handelt am besten mit den Indizes Step Index, Boom und Crash. Der EA kann auch mit Währungspaaren handeln. Der EA kann auch mit echten und synthetischen Indizes handeln. Der Benutzer kann entscheiden, wie viele Pips er pro Handel riskieren möchte (SL). Der Benutzer kann die Anzahl der Pips bestimmen, die er pro Handel anstrebt (TP). Der Benutzer kann die Anzahl der Trades festlegen, die der EA pro Trade öffnen soll. Die Indi

Hier bringe ich Ihnen die Binary Boss OT1.0 MT5-Indikator, der Signale für den Handel der Anstieg oder Fall, höher oder niedriger, Call oder Put und mehr verschiedene Optionen auf der binären Makler bietet.
Dieser Pfeil-Indikator verwendet die technischen Handelsregeln, die Kerzenmuster. der Pfeil erscheint bei der Eröffnung der Kerze für schnelle Einträge und der Indikator bietet mehrere Signale pro Tag für mehr Chancen.
Anweisungen: Auf Deriv oder Iqoptions, stellen Sie die Zeitdauer zwisch

FX Masters EURUSD ist ein Expert Advisor, der auf EURUSD,M5 arbeitet. Er ist ideal für diejenigen, die eine stabile, langfristige Investition mit geringem Risiko wünschen.
Zu den Merkmalen gehören. Extrem hoher Gewinnfaktor (>9) und Gewinnrate (>97%), geringe Drawdowns Sicheres Design ohne Grids oder Martingale Einstiegssignale sowohl für steigende als auch für fallende Märkte Hohe Reproduzierbarkeit durch Wegfall der Kurvenanpassung Einfache Einrichtung, auch für unerfahrene Trader.
Die Einst

Gold DCA Strategy EA - Ihre intelligente Investitionslösung Suchen Sie nach einem Werkzeug, um sicher und gewinnbringend in Gold zu investieren? Der Gold DCA Strategy EA ist die perfekte Wahl für Sie! Die wichtigsten Vorteile : Optimale Einstiegspunkte : Basierend auf RSI überkauften/überverkauften Umkehrsignalen für hohe Genauigkeit. Fortgeschrittene DCA-Strategie : Angetrieben durch einen proprietären Algorithmus in Kombination mit modernster KI-Technologie für intelligentes Kapitalmanageme

Fibo Daily Channel-Indikator Der Indikator ist ein leistungsfähiges Instrument für Händler, das präzise tägliche Unterstützungs- und Widerstandsniveaus auf der Grundlage von Fibonacci-Retracement- und Erweiterungsberechnungen liefert. Dieser Indikator zeichnet automatisch wichtige Pivot-Punkte (PP, R1, R2, S1, S2) sowie zusätzliche Ausdehnungsniveaus (R3, R4, S3, S4) ein und hilft Händlern, potenzielle Umkehr- und Ausbruchszonen einfach zu identifizieren. Der Indikator enthält anpassbare Alarme

Wenn Sie wissen, wie man die Marktstruktur zu lesen, dann ist dieser EA für Sie, stecken und spielen diese EA, wenn Sie die Marktstruktur zu Ihren Gunsten sehen, dann können Sie stecken und spielen diese EA nur auf bestimmte Zeitrahmen wie 30Min, H1 & H4. Denken Sie daran, dass Sie für diesen EA bezahlt, so verwenden Sie es allein und Geld für sich selbst zu machen. Ihr Handel wird sich schneller auszahlen, als Sie denken, so Geduld ist der Schlüssel, nicht nur Plug and Play, lesen Sie die Markt

................................................................................. Dies ist ein sehr AGGRESSIVER EA , JEDOCH sollte die Ersteinlage mehr als 2000$ betragen Getestet auf GBP/USD Paar auf 4H Chart Bitte verwenden Sie genau diese Eingaben: -Lots : 0.3 (oder weniger, wenn Ihre Ersteinlage weniger als 2000$) -StopLoss : 99999 -GewinnmitnahmeGewinn1 : 800 -Gewinnmitnahme2 : 800

Nächster Preis : $399.00
EuroClimb EA: Ihr ultimativer Begleiter für EURUSD-Abwärtstrends! Erschließen Sie die Kraft des Präzisionshandels mit EuroClimb , dem Expert Advisor, der ausschließlich für die Ausnutzung von EURUSD-Abwärtstrends entwickelt wurde. EuroClimb ist auf Short-Positionen zugeschnitten und stellt sicher, dass Sie keine Gelegenheit in einem Abwärtstrend verpassen. Hauptmerkmale: Zeitrahmen : M15 Spezialisierte Leerverkäufe : Konzentriert sich ausschließlich auf Leerverkäufe

Fusion Pro Scalper EA - Scalping mit flexiblen Exit-Strategien Übernehmen Sie die Kontrolle über Ihre Trades mit dem Fusion Pro Scalper EA, der für dynamische Märkte entwickelt wurde. Mit Aroon für die Trenderkennung und ATR für volatilitätsbasierte Einstiege sorgt er für präzise Setups und flexible Ausstiege - ohne sich auf Martingale- oder Grid-Strategien zu verlassen. Hauptmerkmale: Intelligenter Einstieg & Ausstieg : Kombiniert Aroon und ATR für präzise Breakout-Trades. Flexible Ausstiegsop

Wir stellen Ihnen TESTNET EA vor, einen hochgradig anpassungsfähigen Expert Advisor, der entwickelt wurde, um Ihre Handelsleistung mit Präzision und Effizienz zu optimieren. Der TESTNET EA wurde mit einer robusten Logik und unter Verwendung modernster Technologie entwickelt und beinhaltet Moving Average-Strategien, Geldmanagement und Risikokontrolle, um konsistente und zuverlässige Handelsergebnisse zu gewährleisten.
TESTNET EA ist ideal für Trader, die Einfachheit und Effektivität schätzen. E

Ein Roboter, der automatisch auf dem Viop-Markt handelt.
Da SL-TP nicht in der Auftragsart eingegeben werden kann, kann das Programm dies selbst tun.
Es gibt eine folgende SL-Funktion im Programm.
Er kann Trades stoppen, wenn er eine tägliche Gewinnspanne erwischt und eröffnet danach keine Trades.
Er kann in allen Perioden arbeiten. Als Empfehlung eignet sich der Bereich von 5 bis 1h.
Es generiert Handelssignale nach Spread-RSI-EMA-MACD-Filtern und Doji-Hummer-Bullishengulfing-Kerzenmustern

GTrendDetector GTrendDetector liefert Kauf- und Verkaufssignale. Der Indikator berechnet die Kanalgrenzen durch eine rekursive Methode sowie den Durchschnitt, der sich aus diesen Grenzen ergibt. Fällt der Schlusskurs außerhalb der Kanalgrenzen, erzeugt er Kauf-/Verkaufssignale. Der Indikator zeichnet die Kanalgrenzen ein, färbt den Bereich zwischen dem Durchschnitt und dem Schlusskurs ein und zeigt Symbole auf dem Chart an den Stellen an, an denen sich der Trend ändert. Eingabeparameter: Quelle

The Miracle Expert Really Have you ever seen an expert who doubles trades, martingale and grid and can work with a very small capital like $500 or $200 ?! Nein, niemals. Alle diese Arten, die auf dem Markt verbreitet sind, benötigen ein sehr großes Kapital.
Aber mit Dieser Roboter handelt mit Multiplikatoren und Raster, aber es funktioniert mit einer Einzahlung von $ 200, folgt dem Trend, spürt den Wechsel von einem 30-Minuten-und 4-Stunden-Zeitrahmen auf täglich, und seine Einstiegspunkt ist

Synthetische Indizes sind eine besondere Art von Devisenmärkten. Besonders die Boom- und Crash-Indizes auf dem M1-Zeitrahmen sind sehr interessant. Ich dachte immer, dass es unmöglich sei, Spikes sicher zu fangen, bis heute. Alles hat seine Grenzen. Dieser EA basiert auf einer Martingal-Strategie mit geringem Drawdown. Das maximale Grid-Level ist 3. Wenn jeder Trade auf Drawdown geht, wird der nächste Trade mit 2 multipliziert. Der EA verwendet weder Take-Profit noch Stop-Loss . Daher zeigt das

Bullet-Konzepte nutzen Smart Money-Konzepte wie Liquidität und Fair Value Gaps. Der Bot kann an eine faire Umsetzung der ICT silver Bullet Strategie angepasst werden. Die Anpassung in diesem Fall kann angewendet werden, um zu umfassen: Die AM-Sitzung Silver Bullet (10:00 AM - 11:00 AM) Die PM-Sitzung Silver Bullet (02:00 PM - 03:00 PM) Die London Open Silver Bullet (03:00 AM - 04:00 AM) Abhängig von der Serverzeit Ihres Brokers.
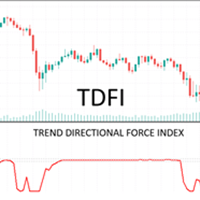
Trade Directional Force Index (TDFI) v1.0 Eine der größten Herausforderungen für Trendhändler besteht darin, in Konsolidierungsphasen Ein- und Ausstiege effektiv zu timen. Diese Phasen sind oft durch ein unterdurchschnittliches Handelsvolumen gekennzeichnet und daher schwierig zu navigieren. In Märkten, in denen keine Volumendaten verfügbar sind, wie z. B. im Devisenhandel, dient der Trend Direction and Force Index (TDFI) als zuverlässiger Ersatz. Der Grund dafür ist, dass Volatilität und Volume

Der Indikator Market Sessions ist bei Devisen- und Aktienhändlern ein beliebtes Instrument zur visuellen Darstellung globaler Handelssitzungen in einem Kursdiagramm. Er hebt die Zeiträume für die wichtigsten Handelssitzungen - wie die asiatische (Tokio) , europäische (London) und amerikanische (New York) Sitzung - direkt im Diagramm hervor. Dies hilft Händlern zu erkennen, wann die Märkte öffnen und schließen, und ermöglicht eine bessere Entscheidungsfindung auf der Grundlage des sitzungsspezif
FREE

EURUSD Algo Trading ist ein einfaches, aber sehr effektives EA auf der MT5-Plattform. Das EA ist speziell für das stabilste Währungspaar der Welt, EURUSD, entwickelt worden. Das EA verwendet eine Tageshandelsstrategie, bei der 90 % der Trades innerhalb weniger Stunden geschlossen werden. Es konzentriert sich darauf, wichtige Niveaus im H1-Zeitrahmen zu identifizieren, um Einstiegspunkte zu finden und angemessene, vordefinierte Stop-Loss-Level (SL) festzulegen. Das EA unterstützt eine Trailing-S

Kostenlose Version von ProEngulfing ist QualifiedEngulfing, mit einer Beschränkung von einem Signal pro Tag und weniger Funktionen. Treten Sie dem Koala Trading Solution Channel in der mql5-Community bei, um die neuesten Nachrichten zu allen Koala-Produkten zu erhalten. Der Beitrittslink ist unten: https ://www .mql5 .com /en /channels /koalatradingsolution Die MT4-Version dieses Produkts ist über den folgenden Link herunterladbar: https ://www .mql5 .com /en /market /product /52023 Einführung

Der Kalender-News-Indikator ist Ihr unverzichtbares Tool für informierten Handel und bietet Echtzeit-Updates zu wirtschaftlichen Ereignissen und Finanznachrichten. Hier sind die Vorteile für Ihre Handelsstrategie: Echtzeit-Updates: Bleiben Sie einen Schritt voraus mit sofortigen Benachrichtigungen zu wichtigen Wirtschaftsindikatoren, Ankündigungen der Zentralbanken und geopolitischen Ereignissen, die die Märkte beeinflussen. Globale Abdeckung: Verfolgen Sie wirtschaftliche Ereignisse auf Märkte
FREE

Hallo Leute, das ist The Rangers Fx Es ist uns gelungen, einen Indikator zum Erkennen von Spitzen beim Boom 1000-Index, Boom 500-Index und Boom 300-Index zu erstellen. Tatsächlich gilt dieser Indikator für alle verfügbaren Booms und die anderen, die noch in der Zukunft kommen. So verwenden Sie diesen Indikator Als Erstes müssen Sie Ihren Zeitrahmen auf den Zeitrahmen M1/M5 umstellen. Dieser Indikator sendet Ihnen eine Benachrichtigung darüber, wann Sie Ihre Kaufgeschäfte tätigen und wann Sie Ihr
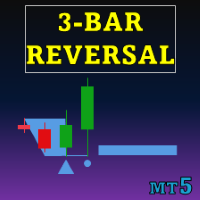
Special offer : ALL TOOLS , just $35 each! New tools will be $30 for the first week or the first 3 purchases ! Trading Tools Channel on MQL5 : Join my MQL5 channel to update the latest news from me Das Drei-Balken-Umkehrmuster-Indikator bietet ein leistungsstarkes Tool für Trader, das automatisch Drei-Balken-Umkehrmuster direkt im Preisdiagramm identifiziert und hervorhebt. Dieser Indikator ist eine wertvolle Ressource zur Erkennung potenzieller Trendumkehrungen und ermöglicht es N

Hallo Leute, hier ist The Rangers Fx. Wir haben es geschafft, einen Indikator zum Erkennen von Spitzen beim Crash 1000 Index, Crash 500 Index und Crash 300 Index zu erstellen. Dieser Indikator gilt für alle verfügbaren Crashes und die anderen, die noch in der Zukunft kommen. So verwenden Sie diesen Indikator: Zunächst müssen Sie Ihren Zeitrahmen auf M1/M5 umstellen. Dieser Indikator sendet Ihnen eine Benachrichtigung, wann Sie Ihre Verkaufsgeschäfte tätigen und wann Sie Ihre Geschäfte beenden/sc
Erfahren Sie, wie man einen Handelsroboter im MetaTrader AppStore, dem Shop für Applikationen für die MetaTrader Handelsplattform, kaufen kann.
Das Zahlungssystem der MQL5.community ermöglicht Zahlungen mit PayPal, Kreditkarten und den gängigen Zahlungssystemen. Wir empfehlen Ihnen eindringlich, Handelsroboter vor dem Kauf zu testen, um eine bessere Vorstellung von dem Produkt zu bekommen.
Sie verpassen Handelsmöglichkeiten:
- Freie Handelsapplikationen
- Über 8.000 Signale zum Kopieren
- Wirtschaftsnachrichten für die Lage an den Finanzmärkte
Registrierung
Einloggen
Wenn Sie kein Benutzerkonto haben, registrieren Sie sich
Erlauben Sie die Verwendung von Cookies, um sich auf der Website MQL5.com anzumelden.
Bitte aktivieren Sie die notwendige Einstellung in Ihrem Browser, da Sie sich sonst nicht einloggen können.