Kostenpflichtige technische Indikatoren für den MetaTrader 5 - 2

Laguerre SuperTrend Clouds adds an Adaptive Laguerre averaging algorithm and alerts to the widely popular SuperTrend indicator. As the name suggests, Laguerre SuperTrend Clouds (LSC) is a trending indicator which works best in trendy (not choppy) markets. The SuperTrend is an extremely popular indicator for intraday and daily trading, and can be used on any timeframe. Incorporating Laguerre's equation to this can facilitate more robust trend detection and smoother filters. The LSC uses the

If you use the MFI (Money Flow Index) indicator, the waiting time till the next signal can be long enough. Now you can avoid sitting in front of the monitor by using MFI Alerts. This is an addition or a replacement to the standard MFI oscillator . Once there appears an MFI signal on the required level, the indicator will notify you with a sound or push, so you will never miss a signal. This is especially significant if you follow the indicator in different timeframes and currency pairs, which ca

Smart Liquidity Levels is a valuable tool for identifying optimal liquidity levels, enabling retail traders like us to strategically set our stop-loss orders. T he essential tool for traders seeking to maximize their trading success. The liquidity level is a critical component of inner circle trading (ICT). It assists us in determining when and how we should enter the market. Watch the video for detailed instructions. Here's why understanding liquidity levels is crucial in trading and how our

Magic Candles ist ein neues Produkt, das die Identifizierung der aktuellen Marktphase (Aufwärtstrend, Abwärtstrend oder Flat) ermöglicht.
Dieser Indikator malt Balken je nach aktueller Marktlage in verschiedenen Farben und informiert den Benutzer mit Warnungen über Trendänderungen.
Magic Candles eignet sich perfekt für den Handel mit Währungen (einschließlich Kryptowährungen) und binären Optionen.
Vorteile Geeignet für Scalping und Intraday-Handel. Der Indikator wird nicht neu gezeichnet

Der Magic Histogram MT5 Indikator ist ein universelles Werkzeug, geeignet für Scalping und mittelfristiges Trading. Dieser Indikator verwendet eine innovative Formel und ermöglicht es Ihnen, die Richtung und Stärke des Trends zu bestimmen. Magic Histogram MT5 wird nicht neu gezeichnet, sodass Sie seine Effizienz anhand von Verlaufsdaten bewerten können. Es ist am besten geeignet für M15, M30, H1 und H4.
Vorteile des Indikators Hervorragende Indikatorsignale! Geeignet für Anfänger und erfahr

Dieses Dashboard ist ein Warntool zur Verwendung mit dem Indikator für die Umkehrung der Marktstruktur. Sein Hauptzweck besteht darin, Sie auf Umkehrmöglichkeiten in bestimmten Zeitrahmen und auch auf die erneuten Tests der Warnungen (Bestätigung) aufmerksam zu machen, wie es der Indikator tut. Das Dashboard ist so konzipiert, dass es auf einem eigenen Chart sitzt und im Hintergrund arbeitet, um Ihnen Benachrichtigungen zu Ihren ausgewählten Paaren und Zeitrahmen zu senden. Es wurde entwickelt,

Market Structure Patterns is an indicator based on smart money concepts that displays SMC/ICT elements that can take your trading decisions to the next level. Take advantage of the alerts , push notifications and email messages to keep informed from when an element is formed on the chart, the price crosses a level and/or enters in a box/zone. Developers can access the values of the elements of the indicator using the global variables what allows the automation of trading
ICT Template Indicator visualizes and automatically updates all important ICT elements for Scalpers, Day and Swing traders. It allows you too keep your chart clean and bring any elements by just one click to the buttons. Thanks to mobile notifications on external liquidity levels, you will not miss any opportunity and you don't have to sit behind the screens whole day. Each element has fully customizable colours, width, line types, max timeframe to be shown etc... so you can really tweak your ch

QM (Quasimodo) Pattern is based on Read The Market(RTM) concepts. The purpose of this model is to face the big players of the market (financial institutions and banks), As you know in financial markets, big traders try to fool small traders, but RTM prevent traders from getting trapped. This style is formed in terms of price candles and presented according to market supply and demand areas and no price oscillator is used in it. RTM concepts are very suitable for all kinds of investments, includi

The Ultimate Trend and Reversals Detector The Ultimate Trend and Reversals Detector is a powerful tool designed to identify potential trend reversal zones in the financial markets. Here are the key features: Objective : Detect trend directions and reversals. Signal Colors : Green : Indicates a potential bullish trend reversal. Red : Signals a potential bearish trend reversal. Non-Repainting : The indicator’s signals are not redrawn, providing reliable information. Suitable for All Styles : Scal

# 33% off - limited time only # ChartSync Pro MT5 is an indicator, designed for the MetaTrader 5 trading terminals. It enables the trader to perform better multi-timeframe technical analysis, by synchronizing symbols and objects into virtually unlimited charts. Built by traders for traders! Telegram Premium Support - Dd you purchase the Chart Sync indicator and need a bit of help? Send us a screenshot with your purchase and your Telegram ID so we can add you to our premium support Telegram g

** All Symbols x All Timeframes scan just by pressing scanner button ** *** Contact me after the purchase to send you instructions and add you in "Wolfe Wave Scanner group" for sharing or seeing experiences with other users.
Introduction: A Wolfe Wave is created with five-wave patterns in price. It shows supply and demand and a fight towards a balance price. T hese waves of price actions can help traders identify the boundaries of the trend . Also It helps forecast how the price will mo

up down v6 for mt5 is no repaint all timeframe and all pairs indicator. red histogram cros trigger that is up point,and put a red point on histogram. and blue histogram cros trigger that is deep point.and put blue point on histogram. this indicator need to sometimes zoom out .for thise pres + button. if newly comes signal is too high makes before invisible.red and blue points are there.to see the signals. indicator is no repaint and can use all time frame and all pairs. only need minimum 500 bar

This is an indicator of trading sessions that can display all levels (Open-High-Low-Close) for four sessions . The indicator can also predict session levels. Sessions can be drawn with lines or rectangles (empty or filled), lines can be extended to the next session. You can easily hide/show each session by pressing hotkeys (by default '1', '2', '3', '4'). You can see ASR (Average Session Range) lines (default hotkey 'A'). This is similar to the ADR calculation, only it is calculated based on

The indicator combines the features of both the Tick charts and Volume Bar charts. The mode can be selected in the indicator's settings.
Tick charts measure the number of transactions per bar. To give you an example if you have a 233 tick chart, each bar measures 233 transactions per bar and a new bar is plotted after 233 transactions. You can choose any number of ticks per bar but most traders choose Fibonacci numbers (1, 2, 3, 5, 8, 13, 21, 34, 55, 89, 144, 233...). Volume bar charts are desi

The Forex Master Pattern is an alternative form of technical analysis that provides a framework which will help you to find and follow the hidden price pattern that reveals the true intentions of financial markets. This algorithm here does a good job detecting the Phase 1 of the Forex Master Pattern cycle, which is the contraction point (or Value).
On Phase 2 we get higher timeframe activation (also called Expansion), which is where price oscillates above and below the average price defined

** All Symbols x All Time frames scan just by pressing scanner button ** *** Contact me after the purchase to send you instructions and add you in "Harmonic Scanner group" for sharing or seeing experiences with other users. Introduction Harmonic Patterns are best used to predict turning point. Harmonic Patterns give you high win rate and high opportunities for trade in during one day. This indicator detects the best and successful patterns based on Harmonic Trading concepts . The Harmonic Patt

Improved version of the free HMA Trend indicator (for MetaTrader 4) with statistical analysis. HMA Trend is a trend indicator based on the Hull Moving Average (HMA) with two periods. HMA with a slow period identifies the trend, while HMA with a fast period determines the short-term movements and signals in the trend direction.
The main differences from the free version: Ability to predict the probability of a trend reversal using analysis of history data. Plotting statistical charts for analyz

It is a MetaTrader 5 integrated drawing tool inspired on the "Pointofix" software. You can paint, make annotations and drawings on the chart in real time. It works in multiple timeframes, that is, the drawings can be visualized in different timeframes. The drawings are also saved in files and can be restored even on MetaTrader restarting.
Simple and Pratical
Chart Pen is designed as simple, beautiful and innovative way to create and manage all your chart analysis. There is no existing drawi
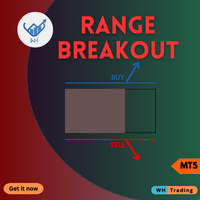
Erschließen Sie eine neue Dimension des Handels mit unserem hochmodernen MQL5-Indikator Range BreakOut MT5
Dieses leistungsstarke Tool wurde entwickelt, um Preisbewegungen zu erkennen und daraus Kapital zu schlagen, wenn sie aus etablierten Bereichen ausbrechen.
Wir bieten Ihnen die Präzision und das Vertrauen, die Sie benötigen, um in der dynamischen Welt der Finanzmärkte erfolgreich zu sein.
MT4-Version : WH Range BreakOut MT4
Merkmale:
Präzise Entfernungserkennung. Breakout-Signa

Introduction
One of the patterns in "RTM" is the "QM" pattern, also known as "Quasimodo". Its name is derived from the appearance of "Hunchback of Notre-Dame" from Victor Hugo's novel. It is a type of "Head and Shoulders" pattern.
Formation Method
Upward Trend
In an upward trend, the left shoulder is formed, and the price creates a new peak higher than the left shoulder peak . After a decline, it manages to break the previous low and move upward again. We expect the pric

Der Indikator zeigt auf dem Chart Marktprofile, an jedem beliebigen Ort, jeder beliebigen Dauer.
Erstellen Sie ein Rechteck im Diagramm, und das Rechteck wird automatisch mit dem Profil gefüllt. Ändern Sie die Größe des Rechtecks oder verschieben Sie es - das Profil folgt automatisch den Änderungen.
Merkmale des Indikators
Die Steuerung des Indikators erfolgt direkt aus dem Diagrammfenster über die Schaltflächenleiste und die Felder für die Parametereingabe.
In der unteren rechten

Crash Spike Master ist die Zukunft für den Handel mit Crash-Märkten. Es wurde entwickelt, um auf den Crash-Märkten 300, 500 und 1000 im 1-Minuten-Zeitrahmen zu laufen. Es hat 2 verschiedene Handelsmodi (Aggressiv und Normal). Der Aggressive Modus wird gelbe und blaue Pfeile zeichnen. Es gibt 2 verschiedene Bedingungen, um Ihnen bei der richtigen Entscheidung zu helfen. Geben Sie den ersten Trade beim gelben Pfeil ein und den zweiten Trade bei der blauen Kerze. Der Stop-Loss (SL) in diesem Modus

King of Dragon-Kanal, King of Dragon-Indikator, King of Dragon-System, King of Dragon MT5, King of Dragon-Klassiker-Indikator, King of Dragon-Wischsystem, König der Drachen in einem
Das Channel-Handelssystem King of Dragon, ein klassisches Channel-Trading-System, wird von vielen Benutzern dringend nach der MT5-Version verlangt. Dieses Programm wurde in mehreren Versionen auf Leistung optimiert und ist bereits ein relativ reibungsloses System. 49$ → 59$ Roter Bereich, langer Trend, nur lang, n

Dies ist ein klarer Indikator für die Beurteilung von Hochs und Tiefs und funktioniert gut für den oszillierenden Markt.
Aktionspreis 49 $ → 59 $
Merkmale gut im Einschätzen von Ober- und Unterteilen Kein Neuzeichnen, kein Driften Schnelle Berechnung, keine Verzögerung Reichhaltiger Erinnerungsmodus Mehrere Parameter und Farben können angepasst werden
Parameter "======== Haupt ========" HighLowPeriod1 = 9 HighLowPeriod2 = 60 HighLowPeriod3 = 34 HighLowEMAPeriod = 4 MASignalPeriode = 5 "==

Was: $99 Now: $34 Blahtech Daily Range indicator displays the average daily range alongside the individual session ranges. Using the daily open price as a reference the indicator shows fixed range and dynamic range targets as lines on the charts. These lines clearly show when the average range has been exhausted. Daily and session ranges can be useful for confirming entries or setting targets and is an excellent odds enhancer for many trading systems. Links [ Documentation | Install |

Trend Chief ist ein fortschrittlicher Indikatoralgorithmus, der Marktgeräusche herausfiltert, den Trend, Einstiegspunkte sowie mögliche Ausstiegsniveaus bestimmt. Verwenden Sie kürzere Zeitrahmen für das Scalping und längere Zeitrahmen für das Swing-Trading. Trend Chief ist perfekt für alle Metatrader-Symbole: Währungen, Metalle, Kryptowährungen, Aktien und Indizes
* So verwenden Sie den Trend Chief-Indikator: - Holen Sie sich den Haupttrend, indem Sie sich die Tages- und H4-Charts ansehen

Ein Indikator, der von der Liquidität und dem gleitenden Durchschnitt abhängt > der Ihnen die 98 % der richtigen Kauf- und Verkaufsentscheidung liefert. und die Zeit, den Handel zu schließen. Der PREIS wird von Zeit zu Zeit steigen > und wann der erste EA gestartet wird, hängt von diesem Indikator ab und wird mehr als 2.000 betragen. 1-wann Kauf- oder Verkaufspositionen eröffnet werden (abhängig vom Kreuz zweier Linien X und Punktberechnungen abhängig vom ausgewählten Rahmen) (das Kreuz sollte a

The UT Bot Alert MT5 Indicator is an advanced technical analysis tool designed to help traders optimize their trading performance. This indicator is MT5 conversion of the UT Bot alerts indicator by “QuantNomad “ in Trading View website and some alert methods are added to provide real-time alerts when a trading signal is generated, in order to allow traders to act quickly and efficiently. Key Features: Alert Types: in addition to the terminal pop-up alerts, the mobile notification sends the alert

Dark Oscillator is an Indicator for intraday trading. This Indicator is based on Counter Trend strategy, trying to intercept changes in direction, in advance compared trend following indicators. We can enter in good price with this Indicator, in order to follow the inversion of the trend on the current instrument. It is advised to use low spread ECN brokers. This Indicator does Not repaint and N ot lag . Recommended timeframes are M5, M15 and H1. Recommended working pairs: All. I nst

MT4 Version Available Here: https://www.mql5.com/en/market/product/43555
Telegram Channel & Group : https://t.me/bluedigitsfx
V.I.P Group Access: Send Payment Proof to our Inbox
Recommended Broker: https://eb4.app/BDFXOsprey *All In One System Indicator, Breakthrough solution for any Newbie or Expert Trader! The BlueDigitsFx Easy 123 System makes it easy to identify important areas of market structure. It alerts you to changes in market structure which typically occur when a revers

** All Symbols x All Timeframes scan just by pressing scanner button ** *** Contact me immediately after the purchase to send you instructions and add you in "Market Structure group" for sharing or seeing experiences with other users. Introduction: Market structure is important for both new and professional traders since it can influence the liquidity and price action of a market. It’s also one of the most commonly used techniques to understand trends, identify potential reversal points,

** All Symbols x All Timeframes scan just by pressing scanner button ** *** Contact me after the purchase to send you instructions and add you in "Head & Shoulders Scanner group" for sharing or seeing experiences with other users. Introduction: Head and Shoulders Pattern is a very repetitive common type of price reversal patterns. The pattern appears on all time frames and can be used by all types of traders and investors. The Head and Shoulders Scanner indicator Scans All char

The indicator displays peak levels of activity formed by the maximum volume, tracks the correlation of the candles on all timeframes (from the highest to the lowest one). Each volume level is a kind of key trading activity. The most important cluster is inside a month, week, day, hour, etc.
Indicator operation features A volume level receives Demand status if the nearest volume level located to the left and above has been broken upwards. A volume level receives Supply status if the nearest vol

VR Sync Charts ist ein Dienstprogramm zum Synchronisieren von Markierungen zwischen Fenstern. Mit VR Sync Charts werden Ihre Trendebenen, horizontale Ebenen, Fibonacci-Markierung mit allen Diagrammen synchronisiert. Das Dienstprogramm erm?glicht, alle Standard-Grafikobjekte im MetaTrader-Terminal zu synchronisieren, alle Ihre Trends, Gann-Linien und andere Objekte werden genau auf benachbarte Diagramme kopiert. Sie m?ssen nicht mehr ihre Lineatur und Markierung manuell kopieren. Unten in den Abb

An indicator based on candlestick patterns
To catch short-term and long-term trends
If it gives a signal in the direction of the trend, it is long term
And if it gives a signal in the opposite direction of the trend, it is short term
Too many signals
Can be used in all symbols
Can be used in all time frames
Attributes: Too many signals Can be used in all symbols Can be used in all time frames Simple settings Simple and fast usage With author lifetime support
Settings: Candle back: Th

Dark Support Resistance is an Indicator for intraday trading. This Indicator is programmed to identify Support and Resistance Lines , providing a high level of accuracy and reliability.
Key benefits
Easily visible lines Only the most important levels will be displayed Automated adjustment for each timeframe and instrument Easy to use even for beginners Never repaints, never backpaints, Not Lag 100% compatible with Expert Advisor development All types of alerts available: Pop-up, Email, Pus

Dieses leistungsstarke Tool identifiziert automatisch Trendlinien, um Ihre Handelsstrategie zu optimieren und fundiertere Entscheidungen zu treffen. MT4 -Version
Schlüsselfunktionen Erkennung der automatischen Trendlinie : Die Anzeige "Basic Trendline" scannt den Markt für potenzielle Trendlinien und zeigt sie sofort in Ihrem Diagramm an.Dies spart Ihnen wertvolle Zeit und stellt sicher, dass Sie nie einen wichtigen Trend verpassen. benutzerfreundliches Panel : Unser Indikator verfügt über

The DYJ SignalSourceOfMACD is based on the MACD indicator. Generally, signals are generated when crossing the MACD and SIGNAL lines of the MACD indicator. Signals to buy are generated if the MACD line crosses over the SIGNAL line in the negative area below the MACD open level. The negative area is where the values of MACD and SIGNAL lines are below zero. The MACD open level parameter is set in pips. However, in the code it is converted as follows: MACD Open level * Instrument.PipSize. For exa

The Breakout Line in technical analysis serves as a crucial tool for understanding market dynamics and potential shifts in price direction. It's designed to highlight rapid accelerations or declines in the market's trajectory. Unconventional Analysis : The Breakout Line is not your typical technical indicator; it's tailored to capture swift market movements, offering a unique perspective on price trends. Angle of the Breakout Line : The sharper the angle formed by the Breakout Line, the stronger

Trap Play refers to a market situation where price initially makes a new high or low, luring traders into believing a strong trend is forming. However, the price quickly reverses and invalidates the breakout, trapping those traders who entered positions based on the initial move. This sudden reversal often results in a rapid exit of positions, leading to significant price movement in the opposite direction. Trap plays can occur in various financial markets and timeframes and are characterized

Market volume profile indicator. It works on almost all instruments - currency pairs, stocks, futures, on real volumes and on ticks. It can be set as automatic determination of the range of building a profile, for example, for a week or a month, etc. and set the range manually by moving the borders (two vertical lines red and blue). Shown as a bar graph. The width of the histogram at a given level means, conventionally, the number of trades made on it. With the "Mode level line color" para

The FFx Universal MTF alerter shows on a single chart all the timeframes (M1 to Monthly) with their own status for the chosen indicator. 9 indicators mode (MACD-RSI-Stochastic-MA-ADX-Ichimoku-Candles-CCI-PSAR). Each can be applied multiple times on the same chart with different settings.
Very easy to interpret. Confirm your BUY entries when most of the timeframes are showing green color. And confirm your SELL entries when most of the timeframes are showing red color. 2 Alert Options : input to

Dieser Indikator zeigt OutsideBars (OB) und InsideBars(IB) im Chart in Kerzenform. Die Farben der Kerzen können individuell eingestellt werden. Auch unterschiedliche Farben für bärische und bullische IBs oder OBs sind möglich.
Zusätzlich ist auch die Farbe der Dochte bzw. Umrandung einstellbar. OutsideBars und InsideBars zeigen oft gute Zonen für Unterstützung oder Widerstand.

The Nadaraya Watson Envelop indicator for MT5 is a popular tool used by traders to identify trends and potential buy/sell signals. The indicator is based on a non-parametric regression model that uses kernel smoothing to estimate the underlying trend of the market. The resulting envelopes are then plotted around the trend line, providing traders with an indication of where prices are likely to fluctuate. One of the key features of this indicator is its ability to send alerts, emails, and notific
Limited time offer, 30 usd only!!!
Discover the unparalleled capabilities of MentFX's structural rules , now optimized for MT5 ! Our state-of-the-art algorithm is engineered to commence calculations from a robust dataset spanning 1500 bars from the current position . This meticulous approach ensures unparalleled accuracy and dependability in your trading endeavors. Experience the seamless integration of MentFX with MT5 , empowering you to analyze markets with precision and confidence. With Me

Modifikation des Relative Strength Index (RSI)-Indikators für mehrere Währungen und mehrere Zeitrahmen. Sie können in den Parametern alle gewünschten Währungen und Zeitrahmen angeben. Außerdem kann das Panel Benachrichtigungen senden, wenn überkaufte und überverkaufte Niveaus überschritten werden. Durch Klicken auf eine Zelle mit einem Punkt werden dieses Symbol und dieser Punkt geöffnet. Dies ist der MTF-Scanner.
Die Taste zum Ausblenden des Dashboards aus dem Diagramm ist standardmäßig „D“.

One of the most powerful and important ICT concepts is the Power of 3. It explains the IPDA (Interbank Price Delivery Algorithm) phases. PO3 simply means there are 3 things that the market maker's algorithm do with price:
Accumulation, Manipulation and Distribution
ICT tells us how its important to identify the weekly candle expansion and then try to enter above or below the daily open, in the direction of the weekly expansion.
This handy indicator here helps you keep track of the weekly

Willkommen beim Twin Peak Indicator MT5 --(Double Top/Bottom)-- Der Double Top and Bottom Indicator ist ein technisches Analysetool zur Identifizierung potenzieller Umkehrmuster auf dem Markt.
Es identifiziert Bereiche, in denen der Preis zwei aufeinanderfolgende Höchst- oder Tiefststände nahezu gleicher Höhe erreicht hat, gefolgt von einer Preisbewegung in die entgegengesetzte Richtung.
Dieses Muster deutet darauf hin, dass der Markt an Schwung verliert und möglicherweise für eine Trendumk

"TPA Sessions" indicator is a very important tool to complement "TPA True Price Action" indicator . Did you ever wonder, why many times the price on your chart suddently turns on a position you can't explain? A position, where apparently no support or resistance level, or a pivot point, or a fibonacci level is to identify? Attention!!! The first run of the TPA Session indicator must be in the open market for the lines to be drawn correctly.
Please visit our blog to study actual trades wit

I recommend you to read the product's blog (manual) from start to end so that it is clear from the beginning what the indicactor offers. This multi time frame and multi symbol divergence dashboard indicator sends an alert when one or two different divergences have been identified. It can be used with all time frames from M1 to MN. Maximum 9 time frames can be shown in the dashboard at the same time. It is possible to enable moving average, RSI or Bollinger bands trend filter to filter out on

The market is unfair if only because 10% of participants manage 90% of funds. An ordinary trader has slim changes to stand against these "vultures". This problem can be solved. You just need to be among these 10%, learn to predict their intentions and move with them. Volume is the only preemptive factor that faultlessly works on any timeframe and symbol. First, the volume appears and is accumulated, and only then the price moves. The price moves from one volume to another. Areas of volume accumu

Einführung in den Indikator Der Indikator basiert auf Formeln für gleitende Durchschnitte, die stabiler sind und weniger Verzögerungen aufweisen als RSI oder CCI. Der Indikator verfügt über drei Indikatorwerte, die Periode des gleitenden Durchschnitts und die Farben der Linie können manuell geändert werden. Was kann Ihnen dieser Indikator bringen? Präzise Einstiegssignale: Der Indikator zeichnet Auf- und Ab-Pfeilsignale. Mehrperioden-Trendanalyse: Wenn Sie diesen Indikator in ein großes Zei

Divergence indicator 10 different indicators. Finding and displaying classic and hidden divergences.
Indicators in which divergences are searched: MACD MACD Histogram; RSI; Stochastic; CCI; momentum; OBV; VWmacd; Chaikin Money Flow; Money Flow Index. This is a replica of the indicator from the tradingview resource, adapted for the MT5 terminal.
MT4 version available here: https://www.mql5.com/en/market/product/87846
Settings: Bars in history for analysis - number of bars for analysis

Beim Handel mit The Strat ist es wichtig, mehrere Zeitrahmen im Auge zu behalten. Dieser Indikator zeigt den täglichen, wöchentlichen, monatlichen und vierteljährlichen Status der aktuellen Kerze für jeden Zeitrahmen an. Ein Kreissymbol zeigt an, dass die Kerze in diesem Zeitrahmen derzeit eine Inside ist, oder Typ 1 in der TheStrat-Terminologie. Eine Inside-Day-Kerze konsolidiert die Kursbewegung, und wir suchen nach einem Ausbruch aus der Spanne. Ein Dreieckssymbol, das nach oben oder unte

Der Indikator besteht aus zwei Teilen. Teil I: Farbkerzen zeigen den großen Trend Farbkerzen dienen dazu, den Marktzustand anhand von Farbkerzen zu identifizieren. Wie in den Screenshots gezeigt, befindet sich der Markt in einem Zustand, in dem Sie Long-Orders platzieren oder Short-Orders beenden sollten, wenn die Farbe Aqua ist. Wenn die Farbe Tomate ist, ist es an der Zeit, Short-Orders aufzugeben oder Long-Orders zu beenden. Wenn sich die Farbe ändert, ist es besser, auf den Abschluss zu wart

"AV Monitor MT5" ist ein Indikator für den MetaTrader 5, welcher die abgeschlossenen Positionen aus der Orders History übersichtlich darstellen kann. Er hilft dabei eine schnelle visuelle Analyse des eigenen Tradings oder verschiedener Expert Advisor untereinander zu erreichen. Vergleiche und analysiere deine Expert Advisor: Welcher ist der Beste?
Ich verwende pro laufendem Expert-Advisor-Chart einen "AV Monitor MT5" Indikator um dessen Performance aufgesplittet nach Long & Short zu verfolgen
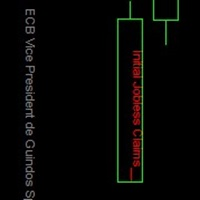
This is one of the most powerful indicators I've ever made.
I was tired of looking at other windows/websites for economical news, and regularly something would happen without me realising.
So I made this indicator which displays all news at the exact time of arrival, directly on the charts!
Now you too can just focus on the charts and know that you won't miss any news events.
There are options:
1. You can choose to display on the price line, or at the bottom of the chart. 2. You can

ATR Scanner Pro is a multi symbol multi timeframe volatility scanner that monitors and analyzes Average True Range indicator value in up to 28 symbols and 9 timeframes in 3 modes : ATR value: As a volatility dashboard it shows the ATR indicator value in all pairs and timeframes and signals when the ATR value reaches a maximum or minimum in a given duration. Short term ATR/Long term ATR ratio: It shows ratio of 2 ATRs with different periods. It's useful in detecting short term volatility and
Exclusive Stairs is a trend indicator for the MetaTrader 5 platform. Its operation algorithm is based on moving averages, processed by special filters and price smoothing methods. This allows the Exclusive Stairs to generate signals much earlier than the conventional Moving Average. This indicator is suitable both for scalpers when used on the smaller timeframes and for traders willing to wait for a couple of days to get a good trade. Exclusive Stairs for the MetaTrader 4 terminal : https://ww

The "VSA on the FLY" indicator is designed to quickly display various Volume Profile / Market Profile parameters.. The indicator takes the initial data for operation from the M1 timeframe. The indicator is installed on any timeframe and starts displaying data starting from the selected left border. This can be the beginning of a day, a week, a trading session, any hour, etc.
The version of this indicator for MetaTrader 4 can be found here .
The following input parameters are available: Show

Easy Trend , as the name implies, is an indicator that easily shows the prevailing trend by bringing several indicators into one. The strategy is: when all indicators point in the same direction a signal is triggered. When red, is a signal to sell, when blue, signal to buy. It is that simple :) There are a total of 9 indicators: Moving Average, RSI, CCI, Parabolic SAR, William's Range, Stochastic, MACD, ADX and Heiken Ashi. It is possible to configure each of these indicators to suit your way of

MT4 Version Understanding market sentiment is a critical aspect of successful trading. Market sentiment refers to the overall feeling or attitude of traders and investors towards a particular financial instrument, such as a stock, currency pair, or cryptocurrency. It is a collective perception of market participants' emotions and beliefs about the asset's future price direction. Market sentiment can be bullish (positive), bearish (negative), or neutral (sideways). Knowing the market sentiment ca

Dieser Indikator zeichnet Preiskanäle. Einfach zu verwenden. Es hat verschiedene Einstellungen, zum Beispiel können Sie es so konfigurieren, dass Kanäle nur zum Kaufen oder Verkaufen angezeigt werden. Sie können Trendlinien anstelle von Kanälen anzeigen. Es gibt viele Handelsstrategien, die auf dem Handel mit Kanälen basieren. Sie können beim Rebound von den Grenzen der Kanäle oder beim Zusammenbruch des Kanals handeln. Parameter Verlauf - die maximale Anzahl von Balken zum Erstellen von Kanä

Dieser Indikator zeichnet bis zu 6 Ebenen auf, die aktiviert / deaktiviert werden können, um das Diagramm gemäß den Anforderungen des Händlers sauberer zu machen
Diese 6 Stufen sind in 2 Sätzen: Hoch und Niedrig
Für jedes Set kann ein anderer Zeitrahmen ausgewählt werden
Es basiert auf der Strategie der Umkehrung des vorherigen Hochs und Tiefs, da davon ausgegangen wird, dass der Preis normalerweise in kürzeren Zeiträumen wie 5 Minuten abgelehnt wird, wenn der Preis das Tages-, Wochen- od
Wenn Sie hier sind, kennen Sie wahrscheinlich bereits die kostenlose Version des Strategie-Scanners . Außerdem suchen Sie möglicherweise ein Tool mit Alarmen, weil es für Sie wichtig ist: Alarme in MetaTrader Alarme auf dem Handy Alarme per E-Mail Alarmsignale Diese Alarme benachrichtigen Sie immer dann, wenn ein anderes Pfeilsymbol auf dem Vermögenswert in der Linie Ihres Rule Plotter Scanners erscheint. Sie können zwischen Alarmsignalen, Alarmen in MetaTrader, Alarmen auf Ihrem Smartphone und

This is advanced Multi-Symbol and Multi-Timeframe version of the "Candle Pattern Finder" indicator (search for candlestick patterns based on the book by Gregory L. Morris "Candlesticks charting explained. Timeless techniques for trading stocks and futures" ). The indicator searches for candlestick patterns for ALL symbols of the "Market Watch" window and for ALL standard timeframes from M1 to MN1. When patterns appear on any symbol / timeframe, the indicator gives a signal (text, sound, sending

Exclusive Arrival: Presenting for the First Time . This is your secret weapon for predicting which way the wind will blow with the next market shift. It assists you in developing your trading strategy by predicting the direction of the next candle. Compatible with forex, stocks, and cryptocurrencies on all timeframes, but higher timeframes are recommended. MT4 Version - https://www.mql5.com/en/market/product/108931/ How does it work ? It's pretty neat. The algorithm separates green and red ca

The indicator automatically builds Support/Resistance levels (Zones) from different timeframes on one chart.
Support-resistance levels are horizontal lines. As a rule, the market does not respond to a specific price level, but to a price range around the level, because demand and supply of market participants are not formed clearly on the line, but are “spread out” at a certain distance from the level.
This indicator determines and draws precisely such a price range within which strong pos

BeST_ Elliot Wave Oscillator Strategies is an MT5 indicator which by default is the difference of two SMAs displayed as a histogram fluctuating around zero while a Signal Line generates Entry Signals either in a Reverse or in a Normal Mode and it is a very powerful tool that very often exploits huge market movements.
Signal Line comes in 2 types:
Advanced Get Type – like the corresponding one used in the homonym analysis package Mov. Average Type – as a Moving Average of the Elliot Oscillat
Der MetaTrader Market ist eine einzigartige Plattform für den Verkauf von Robotern und technischen Indikatoren.
Das Merkblatt für Nutzer der MQL5.community informiert Sie über weitere Möglichkeiten: nur bei uns können Trader Handelssignale kopieren, Programme bei Freiberuflern bestellen, Zahlungen über das Handelssystem automatisch tätigen sowie das MQL5 Cloud Network nutzen.
Sie verpassen Handelsmöglichkeiten:
- Freie Handelsapplikationen
- Über 8.000 Signale zum Kopieren
- Wirtschaftsnachrichten für die Lage an den Finanzmärkte
Registrierung
Einloggen
Wenn Sie kein Benutzerkonto haben, registrieren Sie sich
Erlauben Sie die Verwendung von Cookies, um sich auf der Website MQL5.com anzumelden.
Bitte aktivieren Sie die notwendige Einstellung in Ihrem Browser, da Sie sich sonst nicht einloggen können.