Guarda i video tutorial del Market su YouTube
Come acquistare un Robot di Trading o un indicatore
Esegui il tuo EA
hosting virtuale
hosting virtuale
Prova un indicatore/robot di trading prima di acquistarlo
Vuoi guadagnare nel Market?
Come presentare un prodotto per venderlo con successo
Indicatori tecnici a pagamento per MetaTrader 5 - 2

Laguerre SuperTrend Clouds adds an Adaptive Laguerre averaging algorithm and alerts to the widely popular SuperTrend indicator. As the name suggests, Laguerre SuperTrend Clouds (LSC) is a trending indicator which works best in trendy (not choppy) markets. The SuperTrend is an extremely popular indicator for intraday and daily trading, and can be used on any timeframe. Incorporating Laguerre's equation to this can facilitate more robust trend detection and smoother filters. The LSC uses the

If you use the MFI (Money Flow Index) indicator, the waiting time till the next signal can be long enough. Now you can avoid sitting in front of the monitor by using MFI Alerts. This is an addition or a replacement to the standard MFI oscillator . Once there appears an MFI signal on the required level, the indicator will notify you with a sound or push, so you will never miss a signal. This is especially significant if you follow the indicator in different timeframes and currency pairs, which ca

Smart Liquidity Levels is a valuable tool for identifying optimal liquidity levels, enabling retail traders like us to strategically set our stop-loss orders. T he essential tool for traders seeking to maximize their trading success. The liquidity level is a critical component of inner circle trading (ICT). It assists us in determining when and how we should enter the market. Watch the video for detailed instructions. Here's why understanding liquidity levels is crucial in trading and how our

Magic Candles è un nuovo prodotto che permette di identificare l'attuale fase di mercato (uptrend, downtrend o flat).
Questo indicatore dipinge le barre in diversi colori a seconda dello stato attuale del mercato e segnala all'utente i cambiamenti di tendenza con avvisi.
Magic Candles è perfetto per il trading di valute (comprese le criptovalute) e opzioni binarie.
Vantaggi Adatto per scalping e trading intraday. L'indicatore non viene ridisegnato (ricalcolato), i segnali vengono generati

L'indicatore Magic Histogram MT5 è uno strumento universale, adatto per lo scalping e il trading a medio termine. Questo indicatore utilizza una formula innovativa e consente di determinare la direzione e la forza del trend. Magic Histogram MT5 non viene ridisegnato, quindi puoi valutarne l'efficienza utilizzando i dati storici. È più adatto per M15, M30, H1 e H4.
Vantaggi dell'indicatore Segnali indicatori eccellenti! Adatto a principianti e trader esperti. Utilizzando le impostazioni fles

Questa dashboard è uno strumento di avviso da utilizzare con l'indicatore di inversione della struttura del mercato. Il suo scopo principale è avvisarti di opportunità di inversione su intervalli di tempo specifici e anche di ripetere i test degli avvisi (conferma) come fa l'indicatore. Il dashboard è progettato per essere posizionato su un grafico da solo e funzionare in background per inviarti avvisi sulle coppie e sui tempi scelti. È stato sviluppato dopo che molte persone hanno richiesto un

Market Structure Patterns is an indicator based on smart money concepts that displays SMC/ICT elements that can take your trading decisions to the next level. Take advantage of the alerts , push notifications and email messages to keep informed from when an element is formed on the chart, the price crosses a level and/or enters in a box/zone. Developers can access the values of the elements of the indicator using the global variables what allows the automation of trading
ICT Template Indicator visualizes and automatically updates all important ICT elements for Scalpers, Day and Swing traders. It allows you too keep your chart clean and bring any elements by just one click to the buttons. Thanks to mobile notifications on external liquidity levels, you will not miss any opportunity and you don't have to sit behind the screens whole day. Each element has fully customizable colours, width, line types, max timeframe to be shown etc... so you can really tweak your ch

QM (Quasimodo) Pattern is based on Read The Market(RTM) concepts. The purpose of this model is to face the big players of the market (financial institutions and banks), As you know in financial markets, big traders try to fool small traders, but RTM prevent traders from getting trapped. This style is formed in terms of price candles and presented according to market supply and demand areas and no price oscillator is used in it. RTM concepts are very suitable for all kinds of investments, includi

The Ultimate Trend and Reversals Detector The Ultimate Trend and Reversals Detector is a powerful tool designed to identify potential trend reversal zones in the financial markets. Here are the key features: Objective : Detect trend directions and reversals. Signal Colors : Green : Indicates a potential bullish trend reversal. Red : Signals a potential bearish trend reversal. Non-Repainting : The indicator’s signals are not redrawn, providing reliable information. Suitable for All Styles : Scal

# 33% off - limited time only # ChartSync Pro MT5 is an indicator, designed for the MetaTrader 5 trading terminals. It enables the trader to perform better multi-timeframe technical analysis, by synchronizing symbols and objects into virtually unlimited charts. Built by traders for traders! Telegram Premium Support - Dd you purchase the Chart Sync indicator and need a bit of help? Send us a screenshot with your purchase and your Telegram ID so we can add you to our premium support Telegram g

** All Symbols x All Timeframes scan just by pressing scanner button ** *** Contact me after the purchase to send you instructions and add you in "Wolfe Wave Scanner group" for sharing or seeing experiences with other users.
Introduction: A Wolfe Wave is created with five-wave patterns in price. It shows supply and demand and a fight towards a balance price. T hese waves of price actions can help traders identify the boundaries of the trend . Also It helps forecast how the price will mo

up down v6 for mt5 is no repaint all timeframe and all pairs indicator. red histogram cros trigger that is up point,and put a red point on histogram. and blue histogram cros trigger that is deep point.and put blue point on histogram. this indicator need to sometimes zoom out .for thise pres + button. if newly comes signal is too high makes before invisible.red and blue points are there.to see the signals. indicator is no repaint and can use all time frame and all pairs. only need minimum 500 bar

This is an indicator of trading sessions that can display all levels (Open-High-Low-Close) for four sessions . The indicator can also predict session levels. Sessions can be drawn with lines or rectangles (empty or filled), lines can be extended to the next session. You can easily hide/show each session by pressing hotkeys (by default '1', '2', '3', '4'). You can see ASR (Average Session Range) lines (default hotkey 'A'). This is similar to the ADR calculation, only it is calculated based on

The indicator combines the features of both the Tick charts and Volume Bar charts. The mode can be selected in the indicator's settings.
Tick charts measure the number of transactions per bar. To give you an example if you have a 233 tick chart, each bar measures 233 transactions per bar and a new bar is plotted after 233 transactions. You can choose any number of ticks per bar but most traders choose Fibonacci numbers (1, 2, 3, 5, 8, 13, 21, 34, 55, 89, 144, 233...). Volume bar charts are desi

The Forex Master Pattern is an alternative form of technical analysis that provides a framework which will help you to find and follow the hidden price pattern that reveals the true intentions of financial markets. This algorithm here does a good job detecting the Phase 1 of the Forex Master Pattern cycle, which is the contraction point (or Value).
On Phase 2 we get higher timeframe activation (also called Expansion), which is where price oscillates above and below the average price defined

** All Symbols x All Time frames scan just by pressing scanner button ** *** Contact me after the purchase to send you instructions and add you in "Harmonic Scanner group" for sharing or seeing experiences with other users. Introduction Harmonic Patterns are best used to predict turning point. Harmonic Patterns give you high win rate and high opportunities for trade in during one day. This indicator detects the best and successful patterns based on Harmonic Trading concepts . The Harmonic Patt

Improved version of the free HMA Trend indicator (for MetaTrader 4) with statistical analysis. HMA Trend is a trend indicator based on the Hull Moving Average (HMA) with two periods. HMA with a slow period identifies the trend, while HMA with a fast period determines the short-term movements and signals in the trend direction.
The main differences from the free version: Ability to predict the probability of a trend reversal using analysis of history data. Plotting statistical charts for analyz

It is a MetaTrader 5 integrated drawing tool inspired on the "Pointofix" software. You can paint, make annotations and drawings on the chart in real time. It works in multiple timeframes, that is, the drawings can be visualized in different timeframes. The drawings are also saved in files and can be restored even on MetaTrader restarting.
Simple and Pratical
Chart Pen is designed as simple, beautiful and innovative way to create and manage all your chart analysis. There is no existing drawi
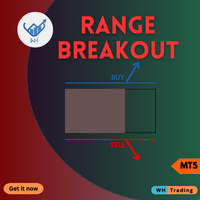
Sblocca una nuova dimensione del trading con il nostro indicatore MQL5 all'avanguardia, Range BreakOut MT5
Questo potente strumento è progettato per identificare e sfruttare i movimenti dei prezzi quando escono dagli intervalli stabiliti,
fornendoti la precisione e la sicurezza necessarie per prosperare nel dinamico mondo dei mercati finanziari.
Versione MT4 : WH Range BreakOut MT4
Caratteristiche:
Rilevamento accurato della portata. Segnali di breakout in tempo reale. Parametri per

Introduction
One of the patterns in "RTM" is the "QM" pattern, also known as "Quasimodo". Its name is derived from the appearance of "Hunchback of Notre-Dame" from Victor Hugo's novel. It is a type of "Head and Shoulders" pattern.
Formation Method
Upward Trend
In an upward trend, the left shoulder is formed, and the price creates a new peak higher than the left shoulder peak . After a decline, it manages to break the previous low and move upward again. We expect the pric

The indicator displays market profiles of any duration in any place on the chart. Simply create a rectangle on the chart and this rectangle will be automatically filled by the profile. Change the size of the rectangle or move it - the profile will automatically follow the changes.
Operation features
The indicator is controlled directly from the chart window using the panel of buttons and fields for entering parameters. In the lower right corner of the chart window there is a pop-up "AP" but

Il Crash Spike Master è il futuro per il trading sui mercati Crash. È stato progettato per funzionare sui mercati Crash 300, 500 e 1000 con un intervallo di tempo di un minuto. Dispone di due modalità di trading differenti (Aggressiva e Normale). La modalità Aggressiva traccerà frecce gialle e blu. Due condizioni diverse per aiutarti a prendere la decisione giusta. Entra nella prima transazione sulla freccia gialla e nella seconda transazione sulla candela blu. Lo stop-loss in questa modalità s

King of Dragon Channel, Indicatore King of Dragon, Sistema King of Dragon, King of Dragon MT5, Indicatore classico King of Dragon, Sistema di scorrimento King of Dragon, Re del drago tutto in uno
Il sistema di trading di canali King of Dragon, che è un classico sistema di trading di canali, molti utenti richiedono fortemente la versione MT5. Questo programma è stato ottimizzato per le prestazioni in più versioni ed è già un sistema relativamente fluido. 49$ → 59$ Zona rossa, trend long, solo

Questo è un chiaro indicatore per giudicare massimi e minimi e funziona bene per il mercato oscillante.
Prezzo promozionale 49$ → 59$
caratteristiche bravo a giudicare alti e bassi Nessun ridisegno, nessuna deriva Calcolo veloce, nessun ritardo Ricca modalità di promemoria È possibile regolare più parametri e colori
parametro "======== Principale ========" HighLowPeriod1 = 9 HighLowPeriod2 = 60 HighLowPeriod3 = 34 HighLowEMAPeriod = 4 MASignalPeriod = 5 "======== Notifica ========" UseAle

Was: $99 Now: $34 Blahtech Daily Range indicator displays the average daily range alongside the individual session ranges. Using the daily open price as a reference the indicator shows fixed range and dynamic range targets as lines on the charts. These lines clearly show when the average range has been exhausted. Daily and session ranges can be useful for confirming entries or setting targets and is an excellent odds enhancer for many trading systems. Links [ Documentation | Install |

Trend Chief è un algoritmo indicatore avanzato che filtra il rumore del mercato, determina la tendenza, i punti di ingresso e i possibili livelli di uscita. Usa intervalli di tempo più brevi per lo scalping e intervalli di tempo più lunghi per lo swing trading. Trend Chief è perfetto per tutti i simboli Metatrader: valute, metalli, criptovalute, azioni e indici * Come utilizzare l'indicatore Trend Chief: - Ottieni la tendenza principale guardando i grafici giornalieri e H4 - Se la tendenza è al

Un indicatore che dipende dalla liquidità e dalla media mobile > che ti danno il 98% di decisione corretta di acquisto e vendita. e il momento di chiudere il commercio. PREZZO aumenterà di volta in volta > e quando verrà lanciato il primo EA dipenderà da questo indicatore sarà più di 2k. 1-quando aprire posizioni di acquisto o vendita (dipende dall'incrocio di due linee X e il calcolo dei punti dipende dal Frame selezionato) (la croce deve essere al di fuori dell'area colorata) la candela deve t

The UT Bot Alert MT5 Indicator is an advanced technical analysis tool designed to help traders optimize their trading performance. This indicator is MT5 conversion of the UT Bot alerts indicator by “QuantNomad “ in Trading View website and some alert methods are added to provide real-time alerts when a trading signal is generated, in order to allow traders to act quickly and efficiently. Key Features: Alert Types: in addition to the terminal pop-up alerts, the mobile notification sends the alert

Dark Oscillator is an Indicator for intraday trading. This Indicator is based on Counter Trend strategy, trying to intercept changes in direction, in advance compared trend following indicators. We can enter in good price with this Indicator, in order to follow the inversion of the trend on the current instrument. It is advised to use low spread ECN brokers. This Indicator does Not repaint and N ot lag . Recommended timeframes are M5, M15 and H1. Recommended working pairs: All. I nst

MT4 Version Available Here: https://www.mql5.com/en/market/product/43555
Telegram Channel & Group : https://t.me/bluedigitsfx
V.I.P Group Access: Send Payment Proof to our Inbox
Recommended Broker: https://eb4.app/BDFXOsprey *All In One System Indicator, Breakthrough solution for any Newbie or Expert Trader! The BlueDigitsFx Easy 123 System makes it easy to identify important areas of market structure. It alerts you to changes in market structure which typically occur when a revers

** All Symbols x All Timeframes scan just by pressing scanner button ** *** Contact me immediately after the purchase to send you instructions and add you in "Market Structure group" for sharing or seeing experiences with other users. Introduction: Market structure is important for both new and professional traders since it can influence the liquidity and price action of a market. It’s also one of the most commonly used techniques to understand trends, identify potential reversal points,

** All Symbols x All Timeframes scan just by pressing scanner button ** *** Contact me after the purchase to send you instructions and add you in "Head & Shoulders Scanner group" for sharing or seeing experiences with other users. Introduction: Head and Shoulders Pattern is a very repetitive common type of price reversal patterns. The pattern appears on all time frames and can be used by all types of traders and investors. The Head and Shoulders Scanner indicator Scans All char

The indicator displays peak levels of activity formed by the maximum volume, tracks the correlation of the candles on all timeframes (from the highest to the lowest one). Each volume level is a kind of key trading activity. The most important cluster is inside a month, week, day, hour, etc.
Indicator operation features A volume level receives Demand status if the nearest volume level located to the left and above has been broken upwards. A volume level receives Supply status if the nearest vol

VR Sync Charts is a tool for synchronizing layout between windows. INDICATOR DOES NOT WORK IN STRATEGY TESTER!!! How to get a trial version with a test period, instructions, training, read the blog https://www.mql5.com/ru/blogs/post/726504 . VR Sync Charts allow you to synchronize trend levels, horizontal levels and Fibonacci layout with all charts. With this you can synchronize all standard graphic objects in the MetaTrader terminal. All your trends, Gann lines and other objects are exactly cop

An indicator based on candlestick patterns
To catch short-term and long-term trends
If it gives a signal in the direction of the trend, it is long term
And if it gives a signal in the opposite direction of the trend, it is short term
Too many signals
Can be used in all symbols
Can be used in all time frames
Attributes: Too many signals Can be used in all symbols Can be used in all time frames Simple settings Simple and fast usage With author lifetime support
Settings: Candle back: Th

Dark Support Resistance is an Indicator for intraday trading. This Indicator is programmed to identify Support and Resistance Lines , providing a high level of accuracy and reliability.
Key benefits
Easily visible lines Only the most important levels will be displayed Automated adjustment for each timeframe and instrument Easy to use even for beginners Never repaints, never backpaints, Not Lag 100% compatible with Expert Advisor development All types of alerts available: Pop-up, Email, Pus

Questo potente strumento identifica automaticamente le linee di tendenza, aiutandoti a semplificare la tua strategia di trading e prendere decisioni più informate. versione MT4
Funzionalità chiave Rilevamento della linea di tendenza automatica : l'indicatore della "tendenza di base" scansiona il mercato per potenziali linee di tendenza e le visualizza istantaneamente sul grafico.Questo ti fa risparmiare tempo prezioso e ti assicura di non perdere mai una tendenza importante. Pannello intuiti

The DYJ SignalSourceOfMACD is based on the MACD indicator. Generally, signals are generated when crossing the MACD and SIGNAL lines of the MACD indicator. Signals to buy are generated if the MACD line crosses over the SIGNAL line in the negative area below the MACD open level. The negative area is where the values of MACD and SIGNAL lines are below zero. The MACD open level parameter is set in pips. However, in the code it is converted as follows: MACD Open level * Instrument.PipSize. For exa

The Breakout Line in technical analysis serves as a crucial tool for understanding market dynamics and potential shifts in price direction. It's designed to highlight rapid accelerations or declines in the market's trajectory. Unconventional Analysis : The Breakout Line is not your typical technical indicator; it's tailored to capture swift market movements, offering a unique perspective on price trends. Angle of the Breakout Line : The sharper the angle formed by the Breakout Line, the stronger

Trap Play refers to a market situation where price initially makes a new high or low, luring traders into believing a strong trend is forming. However, the price quickly reverses and invalidates the breakout, trapping those traders who entered positions based on the initial move. This sudden reversal often results in a rapid exit of positions, leading to significant price movement in the opposite direction. Trap plays can occur in various financial markets and timeframes and are characterized

Market volume profile indicator. It works on almost all instruments - currency pairs, stocks, futures, on real volumes and on ticks. It can be set as automatic determination of the range of building a profile, for example, for a week or a month, etc. and set the range manually by moving the borders (two vertical lines red and blue). Shown as a bar graph. The width of the histogram at a given level means, conventionally, the number of trades made on it. With the "Mode level line color" para

The FFx Universal MTF alerter shows on a single chart all the timeframes (M1 to Monthly) with their own status for the chosen indicator. 9 indicators mode (MACD-RSI-Stochastic-MA-ADX-Ichimoku-Candles-CCI-PSAR). Each can be applied multiple times on the same chart with different settings.
Very easy to interpret. Confirm your BUY entries when most of the timeframes are showing green color. And confirm your SELL entries when most of the timeframes are showing red color. 2 Alert Options : input to

This indicator shows OutsideBars (OB) and InsideBars(IB) in the chart in candle form.
The colors of the candles can be set individually. Also different colors for bearish and bullish IBs or OBs are possible.
In addition, the color of the wicks or Outlines can also be set.
OutsideBars and InsideBars often show good zones for support or resistance. See the Screenshot for some examples.

The Nadaraya Watson Envelop indicator for MT5 is a popular tool used by traders to identify trends and potential buy/sell signals. The indicator is based on a non-parametric regression model that uses kernel smoothing to estimate the underlying trend of the market. The resulting envelopes are then plotted around the trend line, providing traders with an indication of where prices are likely to fluctuate. One of the key features of this indicator is its ability to send alerts, emails, and notific
Limited time offer, 30 usd only!!!
Discover the unparalleled capabilities of MentFX's structural rules , now optimized for MT5 ! Our state-of-the-art algorithm is engineered to commence calculations from a robust dataset spanning 1500 bars from the current position . This meticulous approach ensures unparalleled accuracy and dependability in your trading endeavors. Experience the seamless integration of MentFX with MT5 , empowering you to analyze markets with precision and confidence. With Me

Modifica multivaluta e multitimeframe dell'indicatore Relative Strength Index (RSI). È possibile specificare qualsiasi valuta e intervallo di tempo desiderati nei parametri. Inoltre, il pannello può inviare notifiche quando si attraversano i livelli di ipercomprato e ipervenduto. Cliccando su una cella con un punto, questo simbolo e punto verranno aperti. Questo è lo scanner MTF.
La chiave per nascondere la dashboard dal grafico è "D" per impostazione predefinita.
Similmente al Valuta Stren

One of the most powerful and important ICT concepts is the Power of 3. It explains the IPDA (Interbank Price Delivery Algorithm) phases. PO3 simply means there are 3 things that the market maker's algorithm do with price:
Accumulation, Manipulation and Distribution
ICT tells us how its important to identify the weekly candle expansion and then try to enter above or below the daily open, in the direction of the weekly expansion.
This handy indicator here helps you keep track of the weekly

Benvenuti a Twin Peak Indicator MT5 --(Doppio Top/Bottom)-- Il Double Top and Bottom Indicator è uno strumento di analisi tecnica progettato per identificare potenziali modelli di inversione nel mercato.
Identifica le aree in cui il prezzo ha raggiunto due massimi o minimi consecutivi di altezza quasi uguale, seguiti da un movimento di prezzo nella direzione opposta.
Questo modello indica che il mercato sta perdendo slancio e potrebbe essere pronto per un'inversione di tendenza. *Contattami

"TPA Sessions" indicator is a very important tool to complement "TPA True Price Action" indicator . Did you ever wonder, why many times the price on your chart suddently turns on a position you can't explain? A position, where apparently no support or resistance level, or a pivot point, or a fibonacci level is to identify? Attention!!! The first run of the TPA Session indicator must be in the open market for the lines to be drawn correctly.
Please visit our blog to study actual trades wit

Questo indicatore del dashboard di divergenza multi time frame e multi simbolo invia un avviso quando una o due divergenze diverse sono state identificate su più time frame e non su singole divergenze. Può essere utilizzato con tutte le fasce orarie da M1 a MN. È possibile visualizzare contemporaneamente nella dashboard un massimo di 9 intervalli di tempo. È possibile abilitare il filtro di tendenza della media mobile, dell'RSI o delle bande di Bollinger per filtrare solo le configurazioni più f

The market is unfair if only because 10% of participants manage 90% of funds. An ordinary trader has slim changes to stand against these "vultures". This problem can be solved. You just need to be among these 10%, learn to predict their intentions and move with them. Volume is the only preemptive factor that faultlessly works on any timeframe and symbol. First, the volume appears and is accumulated, and only then the price moves. The price moves from one volume to another. Areas of volume accumu

Indicatore Introduzione L'indicatore è progettato secondo le formule della media mobile, che è più stabile e ha meno ritardo rispetto a RSI o CCI. L'indicatore ha tre valori dell'indicatore, il periodo della media mobile e i colori della linea possono essere modificati manualmente. Cosa può portarti questo indicatore? Segnali di ingresso accurati: l'indicatore disegna segnali freccia su e giù. Analisi delle tendenze multi-periodo: caricando questo indicatore in un grafico a tempi grandi e i

Divergence indicator 10 different indicators. Finding and displaying classic and hidden divergences.
Indicators in which divergences are searched: MACD MACD Histogram; RSI; Stochastic; CCI; momentum; OBV; VWmacd; Chaikin Money Flow; Money Flow Index. This is a replica of the indicator from the tradingview resource, adapted for the MT5 terminal.
MT4 version available here: https://www.mql5.com/en/market/product/87846
Settings: Bars in history for analysis - number of bars for analysis

Quando fai trading usando The Strat , è importante tenere d'occhio più tempi. Questo indicatore mostrerà lo stato giornaliero, settimanale, mensile e trimestrale della candela corrente per ogni periodo di tempo. Un'icona a forma di cerchio mostra che la candela in quel lasso di tempo è attualmente una Inside o Type 1 nella terminologia di TheStrat. Una candela Inside Day sta consolidando l'azione dei prezzi e stiamo cercando un breakout dall'intervallo. Un'icona a triangolo, rivolta verso l'

L'indicatore comprende due parti. Parte I: Le candele colorate mostrano la tendenza principale Le candele colorate servono a identificare lo stato del mercato tramite candele colorate. Come mostrato negli screenshot, se il colore è Acqua, il mercato è in uno stato in cui dovresti piazzare ordini lunghi o uscire da ordini corti. Se il colore è Pomodoro, è il momento di effettuare ordini brevi o di uscire da ordini lunghi. Se il colore sta cambiando, è meglio attendere il suo completamento (fino a

"AV Monitor MT5" is an indicator for MetaTrader 5, which alowes a history analysis of the closed orders. It helps to achieve a quick visual analysis of your own trading or different expert advisors among themselves. Compare and analyze your expert advisors: Which one is the best?
I use an "AV Monitor MT5" indicator per running expert advisor chart to track its performance split into long & short, as well as an index chart e.g. DOW with this indicator and the setting "Show Balance & Equity" to
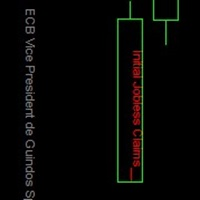
This is one of the most powerful indicators I've ever made.
I was tired of looking at other windows/websites for economical news, and regularly something would happen without me realising.
So I made this indicator which displays all news at the exact time of arrival, directly on the charts!
Now you too can just focus on the charts and know that you won't miss any news events.
There are options:
1. You can choose to display on the price line, or at the bottom of the chart. 2. You can

ATR Scanner Pro is a multi symbol multi timeframe volatility scanner that monitors and analyzes Average True Range indicator value in up to 28 symbols and 9 timeframes in 3 modes : ATR value: As a volatility dashboard it shows the ATR indicator value in all pairs and timeframes and signals when the ATR value reaches a maximum or minimum in a given duration. Short term ATR/Long term ATR ratio: It shows ratio of 2 ATRs with different periods. It's useful in detecting short term volatility and
Exclusive Stairs is a trend indicator for the MetaTrader 5 platform. Its operation algorithm is based on moving averages, processed by special filters and price smoothing methods. This allows the Exclusive Stairs to generate signals much earlier than the conventional Moving Average. This indicator is suitable both for scalpers when used on the smaller timeframes and for traders willing to wait for a couple of days to get a good trade. Exclusive Stairs for the MetaTrader 4 terminal : https://ww

The "VSA on the FLY" indicator is designed to quickly display various Volume Profile / Market Profile parameters.. The indicator takes the initial data for operation from the M1 timeframe. The indicator is installed on any timeframe and starts displaying data starting from the selected left border. This can be the beginning of a day, a week, a trading session, any hour, etc.
The version of this indicator for MetaTrader 4 can be found here .
The following input parameters are available: Show

Easy Trend , as the name implies, is an indicator that easily shows the prevailing trend by bringing several indicators into one. The strategy is: when all indicators point in the same direction a signal is triggered. When red, is a signal to sell, when blue, signal to buy. It is that simple :) There are a total of 9 indicators: Moving Average, RSI, CCI, Parabolic SAR, William's Range, Stochastic, MACD, ADX and Heiken Ashi. It is possible to configure each of these indicators to suit your way of

MT4 Version Understanding market sentiment is a critical aspect of successful trading. Market sentiment refers to the overall feeling or attitude of traders and investors towards a particular financial instrument, such as a stock, currency pair, or cryptocurrency. It is a collective perception of market participants' emotions and beliefs about the asset's future price direction. Market sentiment can be bullish (positive), bearish (negative), or neutral (sideways). Knowing the market sentiment ca

This indicator draws price channels. Easy to use. It has various settings, for example, you can configure it to show channels only for buy or sell, you can display trend lines instead of channels. There are many trading strategies that are based on trading in channels, you can trade on the rebound from the borders of the channels, or the breakdown of the channel. Parameters History - the maximum number of bars for building channels; Distance - the minimum distance from one maximum (or minimum

Questo indicatore traccia fino a 6 livelli che possono essere abilitati/disabilitati per rendere il grafico più pulito secondo il requisito del trader
Questi 6 livelli sono in 2 set: Alto e Basso
Per ogni set, è possibile selezionare un periodo di tempo diverso
Si basa sulla strategia di inversione di precedenti alti e bassi, poiché si ritiene che il prezzo di solito mostri un rifiuto in un intervallo di tempo più breve come 5 minuti quando il prezzo raggiunge il massimo giornaliero, sett
Se sei arrivato qui, è perché conosci già la versione gratuita dello Scanner di strategie . Inoltre, stai cercando uno strumento con avvisi, perché è importante per te: avvisi su MetaTrader avvisi sul cellulare avvisi via e-mail avvisi sonori Questi avvisi ti avviseranno sempre quando compare una freccia diversa sull'asset nella linea del tuo Rule Plotter Scanner. Puoi scegliere tra avvisi sonori, avvisi su MetaTrader, avvisi sul tuo smartphone e avvisi sulla tua e-mail. Sfrutta tutto il potere

This is advanced Multi-Symbol and Multi-Timeframe version of the "Candle Pattern Finder" indicator (search for candlestick patterns based on the book by Gregory L. Morris "Candlesticks charting explained. Timeless techniques for trading stocks and futures" ). The indicator searches for candlestick patterns for ALL symbols of the "Market Watch" window and for ALL standard timeframes from M1 to MN1. When patterns appear on any symbol / timeframe, the indicator gives a signal (text, sound, sending

Exclusive Arrival: Presenting for the First Time . This is your secret weapon for predicting which way the wind will blow with the next market shift. It assists you in developing your trading strategy by predicting the direction of the next candle. Compatible with forex, stocks, and cryptocurrencies on all timeframes, but higher timeframes are recommended. MT4 Version - https://www.mql5.com/en/market/product/108931/ How does it work ? It's pretty neat. The algorithm separates green and red ca

The indicator automatically builds Support/Resistance levels (Zones) from different timeframes on one chart.
Support-resistance levels are horizontal lines. As a rule, the market does not respond to a specific price level, but to a price range around the level, because demand and supply of market participants are not formed clearly on the line, but are “spread out” at a certain distance from the level.
This indicator determines and draws precisely such a price range within which strong pos

BeST_ Elliot Wave Oscillator Strategies is an MT5 indicator which by default is the difference of two SMAs displayed as a histogram fluctuating around zero while a Signal Line generates Entry Signals either in a Reverse or in a Normal Mode and it is a very powerful tool that very often exploits huge market movements.
Signal Line comes in 2 types:
Advanced Get Type – like the corresponding one used in the homonym analysis package Mov. Average Type – as a Moving Average of the Elliot Oscillat
Scopri come acquistare un robot di trading dal MetaTrader Market, il negozio di applicazioni per la piattaforma MetaTrader.
Il sistema di pagamento di MQL5.community supporta le transazioni tramite PayPal, carte bancarie e gli altri sistemi di pagamento più diffusi. Per essere pienamente soddisfatto, ti consigliamo vivamente di testare il robot di trading prima di acquistarlo.
Ti stai perdendo delle opportunità di trading:
- App di trading gratuite
- Oltre 8.000 segnali per il copy trading
- Notizie economiche per esplorare i mercati finanziari
Registrazione
Accedi
Se non hai un account, registrati
Consenti l'uso dei cookie per accedere al sito MQL5.com.
Abilita le impostazioni necessarie nel browser, altrimenti non sarà possibile accedere.