Kostenpflichtige Handelsroboter und Indikatoren für den MetaTrader 4 - 216
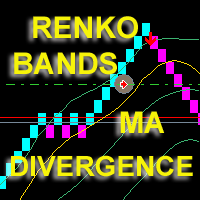
The Expert Advisor displays on a chart renko bars, Bollinger Bands and Moving Average indicators drawn based on Close prices. The EA opens and maintains trades based on divergence. Price peaks are determined when renko bars exit outside the Bollinger bands and move back. A sell trade is opened when the next price peak exists the borders of the upper Bollinger band and is higher than the previous one, and the divergence between the middle Bollinger line and the moving average is less than the poi

Dies ist eine Pin-Bar-Alarmanzeige für mehrere Zeitrahmen. Sie können nur den aktuellen Zeitrahmen oder alle Zeitrahmen von 1 Minute bis zum Monat verwenden.
Wenn Sie alle Zeitrahmen auswählen, erhalten Sie eine Benachrichtigung über den aktuellen Zeitrahmen, in dem Ihr Diagramm geöffnet ist, und über die oben genannten Zeitrahmen.
Für jeden ausgewählten Zeitrahmen gibt es separate Popup-, E-Mail- und Push-Benachrichtigungen.
Der Indikator platziert einen Pfeil auf dem Preisdiagramm. Bei

Gann Grid Der Indikator zeigt Gann-Linien für einen Tag an. Funktioniert nur bei Perioden, die kürzer als täglich sind. Beschreibung der Anzeigeeinstellungen: Count_Bars - die Anzahl der täglichen Balken zur Anzeige der Gann-Linien. Wenn = 0, wird es im gesamten verfügbaren Balkenverlauf angezeigt. scaleGann1 - Skala für Linie # 1 (Anzahl Punkte pro Balken) clrGann1 - Linienfarbe # 1 styleGann1 - Linienstil # 1 widthGann1 - Linienbreite # 1 scaleGann2 - Skala für Linie # 2 clrGann2 - Linienfar

Der ChartChanger ist ein großartiges Hilfsprogramm, um die Anzahl geöffneter Karten auf Ihrem Terminal zu reduzieren. Es gibt drei Abschnitte: Symbole, Zeitrahmen und Vorlagen. Es muss nur ein Diagramm geöffnet sein und Sie können dennoch zu mehreren Diagrammen scrollen. Symbole: Mit einem Knopfdruck können Sie von einem Symbol zum anderen wechseln und Ihre angewendeten Indikatoren bleiben im nächsten Diagramm erhalten. Für die Symbole gibt es einen automatischen Erkennungsmodus, oder Sie können

The EA "Opposite" is a full automated trading expert. The EA uses the hedging strategy as follows: He opens a buy and a sell position at one moment and closes one of the positions after reaching the take profit. Then he opens again two orders in two directions, but in one direction the lot size is bigger than in the other one. Thus one has two possibilities: Either one takes the profit in the direction with less lot size or one takes the profit in the direction with bigger lot size. In the last

Future Candle Two Candle is an arrow indicator of candlestick patterns, based on the calculation of historical statistics. It identifies and calculates patterns consisting of two candles.
Advantages of the indicator Gives information about the next candle right now; The indicator values are based on statistical data on the history of the current instrument; Forecasts and displays the result of trading based on its signals; The colors of the indicator have been selected for a comfortable operat

Future Candle One Candle is an arrow indicator of candlestick patterns, based on the calculation of historical statistics. It identifies and calculates patterns consisting of one candle.
Advantages of the indicator Gives information about the next candle right now; The indicator values are based on statistical data on the history of the current instrument; Forecasts and displays the result of trading based on its signals; The colors of the indicator have been selected for a comfortable operati

Future Candle Three Candle is an arrow indicator of candlestick patterns, based on the calculation of historical statistics. It identifies and calculates patterns consisting of three candles.
Advantages of the indicator Gives information about the next candle right now; The indicator values are based on statistical data on the history of the current instrument; Forecasts and displays the result of trading based on its signals; The colors of the indicator have been selected for a comfortable op

Requirement for the EA use: the EA needs a low spread (recommended spread value is 2) and minimum slippage! The EA is a system that trades the signals generated by the following indicators: Bollinger Bands, Stochastic and Moving Average. The EA works from 00:05 to 08:00, terminal time. By default, all orders are closed at 23:59 (can be modified). Important!!! The EA operation start time should match the American trading session close time, while the operation end time should coincide with the E

This long-term trading system works on 10 pairs and M5 timeframe. It uses various trading systems, such as trend trading, countertrend trading and others. This increases the chances of sustained growth and reduces exposure to a single pair or individual operations. The risk is very controlled. The settings are very simple, there is no need to change them. Optimization is not required as well. Realistic management of internal adjustments. Instead of trying to find the exact values that fit the h

Price Action Breakout is one of the most popular trading strategy. This Price Action Breakout indicator is designed using several indicators combined to be one strategy. It is very useful for traders that trade based on the breakout strategy. It will make it easier to identify the support and resistance levels. This Price action indicator will draw the support and resistance levels on the chart, so it will make it easier to identify the support and resistance levels. It will inform about the sup

The Effort and Result indicator is based on the work of Karthik Marar; a volume spread analysis trader. It compares a price change (Result) to the volume size (Effort) for a certain period. By comparing the effort and result, we can get more information about the future price movement. Both values are normalized and converted to a scale of 0 - 100 % based on a selectable look-back period.
This indicator is also known as the Effort Index.
The law of effort and result The law of effort v

This Script Shows your Account & Symbol information which you use on your graphics. These are: Account Information Number Name Currency Server Leverage Stop Out Level Balance Information Balance Equity Margin Free Margin Symbol Information Symbol Lot Size Min.Lot Lot Step Max.Lot Tick Value Tick Size Spread Stop Loss Level Swap Long Swap Short Initial Margin Maint.Margin Required Margin Trade Allowed

The Avato is one of our standalone tools. (A Signal based on it will also be provided on Mt4 Market in the future). It is designed around a combined form of hedging and martingale techniques and uses sophisticated algorithms and filters to place the trades. It uses Stop loss and Take profit levels while Lot size is calculated automatically following the according multiplier settings. We consider it a toolbox for every seasoned trader. Made with Gold market in mind, it can be tested in other inst

Area 51 EA generiert Signale für verschiedene Strategien. Hat verschiedene Money-Management-Strategien und dynamische Losgrößenfunktion. Wenn eine Position eröffnet wird, ist sie mit einem Take Profit und einem Stop Loss ausgestattet. Wenn die Position rentabel wird, wird ein dynamischer Stop-Loss basierend auf den angegebenen Werten (TrailingStep und DistanceStep) festgelegt und ständig nachgeführt. Auf diese Weise können Sie immer Positionen mit Gewinn schließen. Wenn Sie möchten, dass Ihre ma

The program is designed for copying your successful orders. The price is often fluctuates within a channel. But there is no time to monitor the terminal and place the next orders, especially if it happens at night. Place an order, when it closed with profit, the program repeats your order as a pending limit order. This will continue until the order closes with a loss, or the price goes too far away and the pending order will not trigger. An offset is provided for inclined channels. The order wil

SRP (Strong Retracement/Reversal Points) is a powerful and unique support and resistance indicator. It displays the closest important levels which we expect the price retracement/reversal! If all level are broken from one side, it recalculates and draws new support and resistance levels, so the levels might be valid for several days depending on the market!
Key Features You can use it in all time-frames smaller than daily! Displays closest significant support and resistance levels Update the l

Djinn EA is a fully automated trading robot. Djinn expert system analyzes situation on the market and opens positions in a trend direction. The EA is optimized for GBPUSD pair. When used on H1 chart it is prepared to gain profit in long-term period. Recommended charts are M1 and H1.
Settings Lot - volume of the opened position MaxTrades - maximum number of opened buy or sell trades Maxspread - maximum allowed spread Global_TakeProfit - set to True if you want to automatically close orders when

The indicator allows you to quickly switch from one instrument to another, from one time period to another using the keyboard or buttons on the monitor. Each command can be assigned a hot key from 0-9, a-Z (case-insensitive) and VK_OEM_COMMA ("<" on the keyboard) and VK_OEM_PERIOD (">" on the keyboard). This can help you to operate the maximum number of instruments that are available at your broker, analyze more instruments/periods in less time. This product cannot be tested in the tester , beca

Pivot trend indicator is a trend indicator that uses standard pivot calculation and some indicators. The purpose of the indicator is to calculate the possible trends using the pivot point. And to give the user an idea about trend direction. You can use this display as a trend indicator. Or with other indicators suitable for your strategy.
Features The green bar represents the upward trend. The red bar represents the downward trend. The blue pivot point represents the upward trend. The yellow p

A combination of trend, pullback, range breakouts and statistics in one indicator Mainly functions as an Entry indicator. Works in any pair and timeframe.
Suggested Combination Cluster Helix with Strength Meter Strategy: Confirm signals with ideal strength levels Watch Video: (Click Here)
Features Detects range breakouts on pullback zones in the direction of the trend Analyzes statistics of maximum profits and calculates possible targets for the next signal Flexible tool, can be used in many

The YFX Symbol Watermark indicator is used to display a watermark on your chart, which makes it easy to see at a glance the symbol information for any chart. The displayed information includes: Symbol Name and Timeframe on the chart Description of the currencies Tag line, which can contain any user-defined information All the information can be displayed on the chart so that it can be easily read. The indicator also has parameters that can be set to customize which information is displayed. Para

MACD ColorBars paints bar frames according to a trend, as well as changes the histogram color when MACD bars are rising or falling (if Color Bars is enabled in the inputs window). The growth of bars indicates a divergence between the fast and slow moving averages, while the decrease indicates their convergence.
Parameters
Fast Moving Average - period of the fast moving average; Slow Moving Average - period of the slow moving average; MA method - moving average smoothing method (simple, expone

Measures the length of the selected movement in points, shows the duration of the movement, as well as the speed of movement. Outputs the average value of each dimension.
It is designed to calculate the expected target based on typical market movements.
The intended goal will provide information about the ratio of the stop size to the possible profit and will allow you not to open positions with a small expected profit.
It will also help you determine the point at which it is more logical t

Twins RSI Oszillator basierend auf dem RSI-Indikator. Einstellungen: Preis - der gebrauchte Preis. Es kann einer der folgenden Werte sein: PRICE_CLOSE - Schlusskurs; PRICE_OPEN - Eröffnungspreis; PRICE_HIGH - der Höchstpreis für den Zeitraum; PRICE_LOW - Mindestpreis für den Zeitraum; PRICE_MEDIAN - Medianpreis, (hoch + niedrig) / 2; PRICE_TYPICAL - typischer Preis, (Hoch + Tief + Schluss) / 3; PRICE_WEIGHTED - Gewichteter Schlusskurs (Hoch + Tief + Schluss + Schluss) / 4. RSI_PERIOD - Mittelu
YTG cci Oszillator mit dynamischen Pegeln basierend auf dem CCI-Indikator. Einstellungen: CciPeriod - Mittelungsperiode für die Berechnung des Indikators. Preis - der gebrauchte Preis. AvgPeriod - Mittelungsperiode zur Berechnung der Indikatorglättung. AvgMethod - Mittelungsmethode zur Berechnung der Indikatorglättung. MinMaxPeriod - Zeitraum für die Berechnung dynamischer Pegel. _levelUp ist der Wert der obersten Ebene. _levelDown ist der niedrigere Level-Wert.
Eureka OpgtsFx is a Custom Indicator created to alert the trader when there is a cut-across trend correlations from Daily (D1) to Monthly (MN) Time frames with the belief that the major trend dominates the market and also save the traders from being eaten for breakfast by the big dogs in the financial industry. This indicator is suitable for both the Swing and the Long term Traders due to their peculiar styles of trading and waiting for days, weeks or probably months before taking their profits

The PriceAction_Helper indicator automatically recognizes Japanese candlestick patterns on charts. The indicator marks the location of a candle pattern and indicates the most likely price direction based on that pattern.
Who can use the indicator If you are a novice in trading Japanese candlesticks, PriceAction_Helper will help you detect patterns, demonstrate how they work and enable you to memorize candle pattern types and names. If you are an experienced trader familiar with Price Action, t
Auto-closing a trade using candle Сlose price based on a timeframe opened.
No need to set TP/SL point Make sure connection and PC are always ON (I recommend using 99.9% up-time VPS) Only support for one direction ticket only, if buy and sell ticket exist at the same time, the EA will not activate The EA will automatically activate if the conditions are met
Input NumberOfTry - number of retries if order trigger failed
Condition For Buy Ticket Blue line must be ABOVE the current price Blue l

The trend beads indicator is software that does not include trend indicators such as moving average, Bollinger bands. This indicator works entirely with price and bar movements. The purpose of the indicator is to calculate the most likely trends. To assist the user in determining trend trends. The user determines the trend direction with the colors on the screen. You can use this indicator alone as a trend indicator. Or with other indicators suitable for your strategy.
Trade Rules Rising trend

Golden Monowave is monowave indicator, the monowave theory is one of Elliott wave approach and one of most complicate and accurate method. Golden Monowave can shortcut many major steps to identify and describe the monowave. It works on any timeframe and with any trading instrument, including currencies, indices, futures, etc.
Input Parameters initial_Bars - set the initial number of bars to calculate. wave_color - select the color of the wave. label_color - select the color of labels. temp_lab
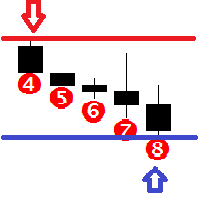
Features This indicator determines consecutive bullish and bearish bars; Determines the High and Low for the last N bars (N can be changed in the settings); It shows the Buy and Sell signals based on the values of other indicators, such as Bollinger Bands, Stochastic and MACD; It graphically displays from 4 to 12 consecutive bullish and bearish bars with an alert; It is possible to disable the alert and unnecessary graphical elements; It is also possible to adjust the number of bars in history,
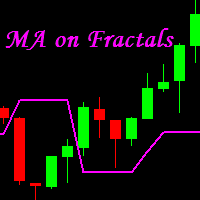
MA on Fractals is a professional trend-following indicator for MetaTrader 4 . It builds a moving average using Bill Williams' fractals. We believe that MA on Fractals is much more efficient than a standard moving average. Its combination with other indicators allows receiving more accurate trading signals. It is most suitable for M15, M30, H1 and H4.
Advantages Unique indicator. Generates minimum false signals. Suitable for beginners and experienced traders. Simple and easy indicator configur

The Expert Advisor of the Forex Fraus family, the system is designed for scalping and adapted for the accounts with fast execution of orders.
Operation Principle It buys and sells based on the values of the internal indicator; When a signal is received, the orders are opened by injection, using tick data; Always sets a stop loss; Positions are closed by Trailing Stop; Not closed positions are closed at the opposite trade; Built-in adjustable risk management block. Depending on the balance, it

"The Niffler is a fluffy, black and long-snouted beast. This burrowing creature has a predilection for anything glittery. Nifflers are often kept by goblins to burrow deep into the earth for treasure." Newt Scamander, "Fantastic Beasts and Where to Find Them". Niffler is a multicurrency trend trading Expert Advisor based on moving averages. A classic seasoned with the magic of modern technology. Niffler uses SMA, EMA, LMA, SWMA, HMA, AMA, TMA, EPMA and RMA on the timeframes M15, M20, H1, H3, H6,

The super oscillator trading system is a trend finding tool. This system consists of a few indicators and a few algorithms. The aim of this indicator is to direct the investor to find healthy trends.
Trade Rules This indicator has two channel lines. These channels are red lines below zero and above zero. There is a line in two places to process. These are blue lines. There is one trend line, the yellow line. Up trend rules Rule 1 - the yellow trend line should close below the red line below th

The EMA Trend indicator is a trend indicator using two moving averages. These two moving average is the main trend indicator with 89 EMA. 89 EMA is generally regarded as a trend in the Forex market. The second moving average is 49 EMA. A trend was created using two moving averages. You can use this display alone as a trend indicator. Or with other indicators suitable for your strategy. This indicator sends a warning every new trend starts.
Features You can select and edit the periods. Time fra

Range bands works the same way as Bollinger bands except that they are self adapting, with range trading in mind. Unless you are familiar with Bollinger bands, it is a standard deviation indicator that is based around the concept that when price deviates to quickly from the average, it's going to encounter resistance. This is true for all period settings, since standard deviation 2 or 3 is an extreme on any data. This indicator automatically chooses the period that is currently most suitable for

Olofofo Fx Scanner is a Custom Indicator created to scan through the currency pair it is being attached to in the market on ALL time frames simultaneously from a Minute to Monthly looking for just 3 things that make Forex trading exciting and worthwhile to invest in. Once these are found, it alerts the User immediately for a timely action on the part of the Trader. This is a self-fulfilling prophecy of the market, meaning that even if you are a newbie, by the time you see the graphical display o

This simple indicator helps defining the most probable trend direction, its duration and intensity, as well as estimate the possible range of price fluctuations. You can see at a glance, at which direction the price is moving, how long the trend lasts and how powerful it is. All this makes the indicator an easy-to-use trend trading system both for novice and experienced traders.
Parameters
Period - averaging period for the indicator calculation. Deviation - indicator deviation. Lag - calculat

TOP Xios is a ready-made trading system, which provides the trader with signals for opening and closing deals. The information panel in the right corner of the screen shows the total number of signals, the number of points in profit or loss and the percentage of valid and false signals. Working with this indicator is very simple. As soon as a blue arrow appears, open a buy deal and wait for a red cross to appear, which indicates the necessity to close the deal. When a red arrow appears, open a s

Real Trend Lines is an indicator that calculates trends using a set of channels and using a set of algorithms. This indicator helps to find trend return points. It generally represents an oscillator. This trend tracking system helps the investor to understand small or large trends and determines the direction according to it.
Trending features Up trend Rule 1 - yellow trend line should be below zero level. Rule 2 - the yellow trend line should be in the green and orange channel. Rule 3 - the t

Ideally, this is we hope : The good numbers on news should make the related currency become stronger, and the bad numbers on news should make the related currency become weaker. But the fact is: The good numbers on news that has been written on the economic news calendar could not always instantly make the related currency become stronger. and vice versa, the bad numbers could not always instantly make the related currency become weaker. Before placing new position: We need to know which actuall

This tool is developed to make your trading risk and profit management easier. It is able to move all of your opened transaction's take profit and stop loss on to one similar price.
How to use Draw a trend line/horizontal line and name it to "tp_" as the take profit line and "sl_" as the stop loss line. The EA will modify all of your orders' and pending orders' take profit and stop loss to the given line. You can drag the gray box to drag the line. You can see the risk in the account currency

If you would like to trade reversals and retracements, this indicator is for you. The huge advantage is that the indicator does not have input parameters. So, you will not waste your time and will not struggle to change them for different timeframes and symbols. This indicator is universal. The green triangle represents a possibility to go long. The red triangle represents a possibility to go short. The yellow dash represents a "non-trading" situation. This indicator could be used on M1, M5, M15
This is a fully automated multi-currency Expert Advisor with unlimited number of currency pairs using MACD and Envelopes indicators. You can specify how the EA should work with each currency pair. You can add orders manually. The free version is available here .
Parameters Common TradeObjectsDelete : delete trade objects. OrderPanel : display the panel for opening orders. TradeToBalance : target balance to stop trading. The parameter is triggered only after all trades are closed. Otherwise, i

The High and Low Points indicator is designed to calculate potential order points. The main feature of this indicator is to specify the points that the price can not exceed for a long time. The market always wants to pass points that can not pass. It is necessary to place an order waiting for this point indicated by this indicator. Is an indicator that constitutes many EA strategies. Designed for manual trading.
Transaction Strategies High point buy stop order Low point sell stop order For exa
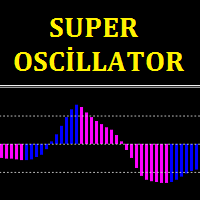
Super oscillator indicator is an oscillator designed to calculate trend reversal points. A set of bar calculations and a set of algorithms to calculate trend reversals. Level probing system with high probability trends. All of these features combine to make it easier for investors to find trends.
Suggestions and Features There are two levels on the super oscillator indicator. They are at levels of 0.5 and -0.5. The oscillator bar should be below -0.5 to find the upward trend. And a blue color

OneWayTicket indicator is based on CCI indicator. In fact, it analyzes multiple CCIs from several timeframes. There are four Ways of OneWayTicket, read from left to right - 15 min, 30 min, 1 hour and 4 hours. The idea is to enter the market when all four CCIs agree on a trend. A trader chooses which timeframes to monitor. When all four ways of the OneWayTicket are green - Buy . When all four ways of the OneWayTicket are bright red - Sell . Original idea from the author: tageiger, revised for the

The indicator shows the market turning points (entry points).
Reversals allow you to track rebound/breakout/testing from the reverse side of the lines of graphical analysis or indicators.
Reversals can be an independent signal. The indicator allows you to determine reversals taking into account the trend and without it. You can choose a different period for the movement preceding the reversal, as well as the volatility coefficient. When plotting reversals, the indicator takes into account vola

SMArtin is an adaptation of the classic SMA+WPR strategy, which enters the market at the overbought/oversold states of the WPR indicator, with the SMA indicator as a filter. Trading is performed during the European and at the beginning of the American sessions. If there is a loss, the next entry will be made with an increased lot, and with an increased take profit in a trade series (which allows using a smaller order volume and, correspondingly, decrease the deposit load). Symbol : EURUSD; Timef
This indicator detects IDRN4 and IDNR7 two powerful patterns on 28 pairs on new daily bar. IDNR4 is the acronym for "Inside Day Narrow Range 4" where "Inside Day" is a lower high and higher low than the previous bar and "Narrow Range 4" is a bar with the narrowest range out of the last 4 bars so "Narrow Range 7" out of the last 7 bars. Hence, ID/NR4 and better ID/NR7 are an objective criterion for identifying days of decreased range and volatility. Once we find an ID/NR4 or an ID/NR7 pattern, we
Use this script to export the price history to MATLAB mat files from any chart. Optionally, a CSV file can be created. This script allows easily creating and verifying your trading strategy in MATLAB, for example, statistical arbitrage or pairs trading strategies.
Input parameters startDT: start export from this date and time. Can be '1970.01.01 00:00:00' to start from the first available date and time. endDT: the last date and time in the file. Can be '1970.01.01 00:00:00' to export until the

Twins Oszillator basierend auf dem stochastischen Indikator. Die oberen Messwerte des Indikators können als Kaufsignale verwendet werden, die unteren Messwerte des Indikators können als Messwerte für Verkaufssignale verwendet werden. Einstellungen: Kperiod - Periode (Anzahl der Balken) zur Berechnung der %-K-Linie. Dperiode - Mittelungsperiode zur Berechnung der %-D-Linie. verlangsamen - verlangsamen. Methode - Mittelungsmethode (einfach, exponentiell, geglättet, linear gewichtet). price - Pre

Operation principles The main advantage of the Expert Advisor is that you do not need to set multiple parameters and understand the Forex market principles. All you need is to set one parameter according to the recommendations given in the description and launch the EA. The robot calculates the necessary lot volume, acceptable risk and closing amount. The EA works on any timeframe and symbol. Several parameters and indicators are analyzed during the EA operation. Orders are opened and profit is

Every successful trader knows what support and resistance spots are working. And always know that these points need to be kept in mind. They always trade according to this point. The support and resistance point indicator operates in two different modes. The first is the standard support and resistance points we know. The second is Fibonacci levels. This indicator automatically calculates and displays the support and resistance points on the screen.
Features You can select the time frame you w

Critical Regions Explorer displays two fixed regions daily. These regions are powerful regions where price are likely change direction. It can be best used with all timeframes less than or equal to Daily timeframes and can be used to trade any instruments.
Graphical Features Critical regions display. No repainting.
General Features Automated terminal configuration. Accessible buffers for EA requests.
How to Trade At the start of the day, do these four things: Identify upper critical region
This Expert Advisor uses ATR as CORE indicator for GRID operative.ATR measures intrinsec volatility. Using ATR on a GRID, you will give enought space between lines considering current volatility.
On this EA, you can set ATR period and timeframe parameters, and also you can set a ATR multiplier factor, to increase margin between each GRID level. In the same way, you can also configure the number of GRID levels (up and down) as well as the color of the drawn lines.
In addition, it has a start/
Dieser Indikator erkennt Breakout anhand der Erkennungsstrategie für Eingabeparameterbalken. Sie können die WaitForBarClosed-Funktion verwenden, um Signale zu bestätigen (true), aber sie wird manchmal etwas später als false aktiviert. Der Indikator öffnet sich in einem separaten Fenster. Geeignet für alle Zeitrahmen und Paare. Die blaue Linie zeigt die Trendrichtung.
Befestigen Sie den Indikator an einem beliebigen Diagramm Wählen Sie die gewünschten Eingänge auf der Registerkarte „Eingänge“

This indicator is designed to filter trends. Using the RSI indicator we know. It is aimed to confirm trends with this indicator. Can be used alone. It can be used as an indicator to help other indicators. He is already a trend indicator. You can confirm the signals given by other indicators according to your strategy with this indicator. The RSI Trend Filtering indicator confirms trends using a number of complex algorithms. Red below trend zero represents the downward trend. If trend is blue abo

Tired of online risk calculators that you manually have to fill out? This neat little dashboard instantly shows you, your risk, reward and risk vs reward as soon as you've sat your Stop-loss or Take-profit. Works on both market and pending orders. By far, my most used indicator when trading manually on mt4.
Advantages Can handle multiple positions. And gives the total risk and reward for all positions on all manually placed or pending positions on the current chart. Automatically recalculates

This multi time frame and multi symbol indicator identifies high-probability breakout patterns. It does this by identifying strong, symmetrical pennants and triangles. This pattern DOES NOT appear very often on higher time frames. But when it does, it is a very high-probability setup. The indicator also includes an Inside bars scanner. It can for example be used to detect a special type of Inside bars formation which is formed by a Master candle (MC) followed by 4 inside candles (please see the
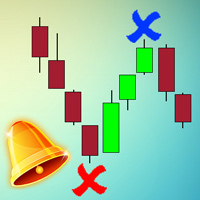
The MACD_stopper_x2 indicator shows where the trend has a tendency to stop or reverse. It uses the standard MACD indicator and a proprietary formula for processing data obtained from MACD. There are 2 types of stop/reversal signals: Small cross - probability of a trend stop/reversal is 70-80% Large cross - probability of a trend stop/reversal is 80-80% If there are open trades (for example, BUY) on the symbol the indicator is attached to, and the BUY trend ends, the indicator sends push notifica
This is a simplified and effective version of the library for walk forward analysis of trading experts. It collects data about the expert's trade during the optimization process in the MetaTrader tester and stores them in intermediate files in the "tester/Files" directory. Then these files can be used by the special WalkForwardBuilder script to build a cluster walk forward report and rolling walk forward reports for refining it. The intermediate files should be manually placed to the "MQL4/Files
The Expert Advisor for trading AUD/USD M5. It is based on the strategy of microtrend detection, market entry (and exit) points are calculated based on the correlation of indicators. The trading volume for opening a position depends on results of previous trades. It is possible to limit the amount of risk (the AutoMM parameter). It is also possible to set the maximum spread, above which the EA will automatically suspend trading (the MaxSpread parameter). It uses an efficient trailing, which autom
"Ich glaube, dass man das beste Geld an den Wendepunkten des Marktes macht. Alle sagen, dass man sich umbringt, wenn man versucht, die Hochs und Tiefs auszusuchen, und dass man sein ganzes Geld mit dem Trend in der Mitte macht. Nun, zwölf Jahre lang habe ich das Fleisch in der Mitte verpasst, aber ich habe eine Menge Geld bei Höchst- und Tiefstständen verdient."
- Paul Tudor Jones -
Handelsstrategie: Einstieg in den Markt bei einer Trendumkehr oder einem Rücksetzer. Währungspaar: EUR/USD. E

This is a complex indicator for developing custom trading strategies. It can also sort out already existing strategies. The initial objective of the indicator was to combine a couple of indicators. After combining 12 indicators, I realized I need to implement the ability to separate them as well as arrange the signals from the built-in indicators and systems. The indicator provides signals as buffer arrows: 0 - buy, 1 - sell. The contents of the complex indicator:
Indicators Let me know if you

PointerX is based on its own oscillator and built-in indicators (Pulser, MAi, Matsi, TCD, Ti, Pi) and operates independently.
With PointerX you can create your own strategies . Theoretically all indicator based strategies are possible, but not martingale, arbitrage, grid, neural networks or news.
PointerX includes 2 Indicator Sets All Indicator controls Adjustable Oscillator Take Profit controls Stop Loss controls Trades controls Margin controls Timer controls and some other useful operations.

The Quantum Expert Advisor is designed for trading EURUSD H1 . The trading algorithm lies in placing pending orders at the peaks of currency fluctuations, after a preliminary analysis of the market conditions. Trading is fully automated. Lot size is calculated automatically based on the lot percentage.
Parameters MaxRisk - percentage of the deposit, used for the automatic calculation of the lot. LongWave - long wave of price fluctuation. ShortWave - short wave of price fluctuation. Level contr

Super signal series trend arrows is an indicator designed to generate trading signals. This indicator uses a number of different indicators and generates a signal using a number of historical data. It generally tries to calculate the trend return points. These trend returns may be sometimes very large, sometimes small. The investor should act with the belief that the signal may be small. Monthly median produces 5 to 10 signals. These signals vary according to market conditions. The signals do no
Der MetaTrader Market ist die beste Plattform für den Verkauf von Handelsroboter und technischen Indikatoren.
Sie brauchen nur ein gefragtes Programm für die MetaTrader Plattform schreiben und schön gestalten sowie eine Beschreibung hinzufügen. Wir helfen Ihnen, das Produkt im Market Service zu veröffentlichen, wo Millionen von MetaTrader Benutzern es kaufen können. Konzentrieren Sie sich auf dem Wesentlichen - schreiben Sie Programme für Autotrading.
Sie verpassen Handelsmöglichkeiten:
- Freie Handelsapplikationen
- Über 8.000 Signale zum Kopieren
- Wirtschaftsnachrichten für die Lage an den Finanzmärkte
Registrierung
Einloggen
Wenn Sie kein Benutzerkonto haben, registrieren Sie sich
Erlauben Sie die Verwendung von Cookies, um sich auf der Website MQL5.com anzumelden.
Bitte aktivieren Sie die notwendige Einstellung in Ihrem Browser, da Sie sich sonst nicht einloggen können.